 Back
Introduction to Statistics: Foundations, Data Types, and Experimental Design
Study Guide - Smart Notes
 Tailored notes based on your materials, expanded with key definitions, examples, and context.
What is Statistics?
Definition and Importance
Statistics is the science of collecting, organizing, summarizing, analyzing, and interpreting data to make decisions, answer questions, and draw conclusions. It is essential for making informed decisions in everyday life, government policy, medicine, business, and more.
Data: Information obtained from observations, counts, measurements, or responses.
Statistics helps verify beliefs with evidence and supports critical decisions in health, economics, and public policy.
Examples of Statistical Statements
"People who eat three daily servings of whole grains have been shown to reduce their risk of stroke by 37%."
"Seventy percent of the 1500 U.S. spinal cord injuries to minors result from vehicle accidents, and 68 percent were not wearing a seatbelt."
"In 2007, Florida’s High School graduation rate was 65% compared with that of the U.S. at 74%."
Statistical statements can be correct or incorrect depending on data collection, analysis, and interpretation. Bias and controversy can arise from improper methods or misinterpretation.
Populations, Samples, and Data Sets
Definitions
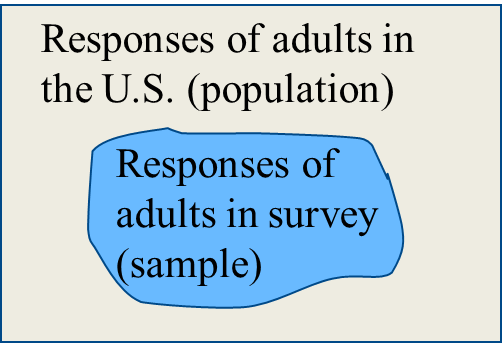
Population: The entire collection of outcomes, responses, measurements, or counts of interest.
Sample: A subset of the population, selected for analysis.
For example, if we survey 1708 adults in the U.S. about global warming, the population is all U.S. adults, and the sample is the 1708 surveyed individuals.
Parameters and Statistics
Parameter: A numerical summary describing a population characteristic (e.g., average age of all people in the U.S.).
Statistic: A numerical summary describing a sample characteristic (e.g., average age of people from three states).
Parameters refer to populations; statistics refer to samples.
Branches of Statistics
Descriptive vs. Inferential Statistics
Descriptive Statistics: Organizing, summarizing, and displaying data using tables, charts, and averages.
Inferential Statistics: Using sample data to draw conclusions or make inferences about a population.

Example: Survival Rates
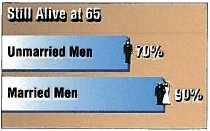
In a study of men aged 48, 70% of unmarried men and 90% of married men were alive at age 65. The descriptive statistics are the reported percentages; the inference might be that marriage is associated with longer life.
Types of Data
Qualitative vs. Quantitative Data
Qualitative (Categorical) Data: Attributes, labels, or non-numerical entries (e.g., eye color, place of birth).
Quantitative (Numerical) Data: Numerical measurements or counts (e.g., age, weight, temperature).
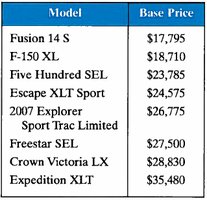
Example: In a table of vehicle models and base prices, the model names are qualitative, and the base prices are quantitative.
Levels of Measurement
Four Levels
Nominal: Qualitative only; categorized by names, labels, or qualities (e.g., network affiliates).
Ordinal: Data can be ordered or ranked, but differences are not meaningful (e.g., TV program rankings).
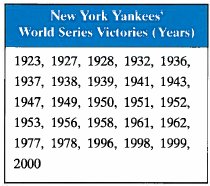
Interval: Quantitative; ordered with meaningful differences, but no true zero (e.g., years of World Series victories).
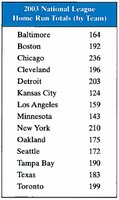
Ratio: Quantitative; ordered with meaningful differences and a true zero, allowing ratios (e.g., home run totals by team).


Sampling Techniques
Types of Sampling
Simple Random Sample: Every possible sample of the same size has an equal chance of being selected.
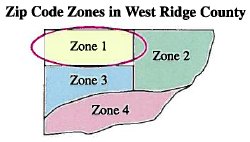
Stratified Sample: Population divided into groups (strata), and a random sample is taken from each group.
Cluster Sample: Population divided into clusters, and all members of one or more clusters are selected.
Systematic Sample: Every kth member of the population is selected after a random starting point.
Convenience Sample: Members are selected based on ease of access, which may introduce bias.
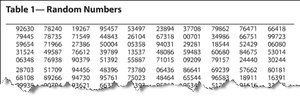
Random numbers can be used to select samples.
Experimental Design
Data Collection Methods
Observational Study: Observes and measures characteristics without influencing the subjects.
Experiment: Applies a treatment to part of a population and observes the effects.
Simulation: Uses models to reproduce conditions, often when real experiments are impractical or dangerous.
Survey: Collects data by asking questions to a sample of the population.
Key Elements of Experimental Design
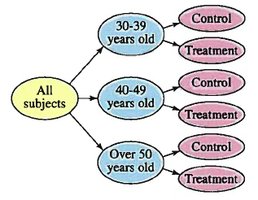
Control: Controlling for variables other than the one being measured.
Randomization: Randomly assigning subjects to treatment groups to reduce bias.
Replication: Repeating the experiment with a large number of subjects to ensure reliability.
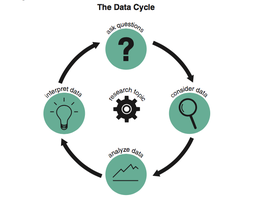
Designing a Statistical Study
Ask good questions.
Determine what data is available to answer the question.
Analyze data using graphs, charts, or tables.
Interpret data and answer the research question.
Note: Anecdotes are not considered valid data for statistical analysis, but may inspire hypotheses for further study.
