 Back
BackIntroduction to Statistics: Foundations, Sampling, and Types of Studies
Study Guide - Smart Notes
 Tailored notes based on your materials, expanded with key definitions, examples, and context.
Section 1.1: What Is/Are Statistics?
Definition and Purpose of Statistics
Statistics is the science of collecting, organizing, analyzing, and interpreting data to make decisions. It provides methods for drawing conclusions from data and quantifying uncertainty.
Statistics: The science of collecting, organizing, and interpreting data.
Data: Numbers or other pieces of information that describe characteristics of a sample or population.
Basic Ideas of Statistical Studies
Statistical studies involve gathering data from a sample to make inferences about a population. For example, surveys conducted by organizations like Nielsen Media Research use samples to estimate television viewership across the U.S.
Population: The entire group of individuals or items of interest.
Sample: A subset of the population selected for study.
Parameter: A numerical summary describing a characteristic of a population.
Statistic: A numerical summary describing a characteristic of a sample.
Goal of Research
The primary goal in statistics is to use information from a sample to draw conclusions about a population. This process involves estimating population parameters and quantifying the uncertainty of these estimates.
Definition of Population and Parameter
A population is the complete set of individuals or items being studied, while a parameter is a specific numerical value describing a characteristic of the population.
What We Actually Study
Because it is often impractical to study an entire population, researchers collect data from a sample. The results from the sample are then used to infer information about the population.
Definitions: Sample, Raw Data, and Statistic
Sample: A subset of the population from which data are actually obtained.
Raw Data: The actual measurements or observations collected from the sample.
Statistic: A value calculated from the sample data, used to estimate a population parameter.
Relationship Between Sample Statistics and Population Parameters
Sample statistics are used to estimate population parameters. The accuracy of these estimates depends on how representative the sample is of the population and the size of the sample.
Margin of Error and Confidence Interval
The margin of error quantifies the uncertainty in an estimate from a sample. A confidence interval provides a range of values within which the population parameter is likely to fall.
Margin of Error (M.E.): The maximum expected difference between the statistic and the parameter.
Confidence Interval: An interval estimate, typically expressed as:
Process of Statistics
The process of conducting a statistical study involves several key steps:
State the goal of the study.
Choose a representative sample from the population.
Collect raw data from the sample and summarize it.
Use the sample statistics to infer information about the population.
Draw conclusions and communicate results.
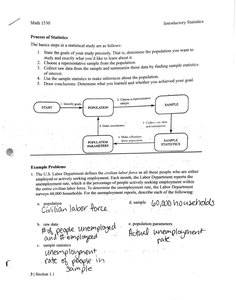
Example Problem
Suppose the U.S. Labor Department surveys 60,000 households to estimate the unemployment rate. Here, the population is the civilian labor force, the sample is the 60,000 households, the parameter is the actual unemployment rate, and the statistic is the percentage of unemployed people in the sample.
Section 1.2: Sampling
Importance of Sampling
Sampling is essential because it is often impractical or impossible to collect data from an entire population. A well-chosen sample allows researchers to make valid inferences about the population.
Census: A study that collects data from every member of the population.
Representative Sample: A sample that accurately reflects the characteristics of the population.
Bias in Sampling
Bias occurs when a sample is not representative of the population, often due to poor sampling methods or non-random selection. Biased samples can lead to incorrect conclusions.
Sampling Methods
Simple Random Sample: Every member of the population has an equal chance of being selected.
Stratified Sample: The population is divided into subgroups (strata), and a random sample is taken from each stratum.
Cluster Sample: The population is divided into clusters, some clusters are randomly selected, and all members of selected clusters are included.
Systematic Sample: Every nth member of the population is selected after a random starting point.
Convenience Sample: The sample is chosen based on ease of access; often leads to bias.
Things to Remember about Sampling
A successful study requires a representative sample.
Biased samples can lead to invalid conclusions.
Random sampling methods are preferred to minimize bias.
Example Problems: Identifying Sampling Methods
Given various scenarios, students are asked to identify the sampling method used (e.g., cluster, stratified, convenience, simple random, systematic) and to evaluate the quality of the sample.
Section 1.3: Types of Statistical Studies
Observational Studies vs. Experiments
Statistical studies can be classified as either observational studies or experiments. The distinction is based on whether the researcher actively manipulates variables or simply observes existing conditions.
Observational Study: The researcher observes and records data without influencing the subjects.
Experiment: The researcher applies a treatment to subjects and observes the effects.
Variables
Variable: Any item or quantity that can take on different values.
Explanatory Variable: The variable that is manipulated or categorized to observe its effect.
Response Variable: The outcome measured in the study.
Types of Observational Studies
Retrospective Study: Data are collected from the past (e.g., records, interviews).
Prospective Study: Data are collected in the future from groups sharing common factors.
Experimental Design
Treatment Group: The group receiving the treatment.
Control Group: The group not receiving the treatment, used for comparison.
Confounding Variable: An outside variable that can affect the results, making it difficult to determine the effect of the explanatory variable.
The Placebo Effect and Blinding
Placebo Effect: Improvement resulting from the belief in the treatment rather than the treatment itself.
Single-Blind Study: Subjects do not know whether they are in the treatment or control group.
Double-Blind Study: Neither the subjects nor the experimenters know who is in the treatment or control group.
Meta-Analysis
Meta-analysis is a statistical technique that combines results from multiple studies to identify patterns or overall effects.
Common Issues in Experimental Design
Bias due to non-random assignment or lack of blinding.
Confounding variables that obscure causal relationships.
Placebo effects that can influence outcomes.
Example Applications
Examples include studies on the effects of music on test performance, the impact of magnets on pain relief, and the influence of media coverage on public opinion. Each example illustrates the importance of proper sampling, control groups, and awareness of confounding variables.
