 Back
BackIntroduction to Statistics: Key Concepts and Foundations
Study Guide - Smart Notes
 Tailored notes based on your materials, expanded with key definitions, examples, and context.
Statistics: The Science of Data
Definition and Scope
Statistics is the science of collecting, organizing, summarizing, and analyzing information to draw conclusions or answer questions. It also provides a measure of confidence in any conclusions drawn from data.
Data: Information collected for analysis.
Measure of Confidence: Quantifies the reliability of statistical conclusions.
Populations, Samples, and Individuals
Key Terms and Relationships
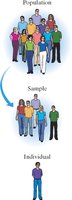
Understanding the structure of statistical studies requires distinguishing between populations, samples, and individuals.
Population: The entire group of individuals to be studied.
Sample: A subset of the population selected for study.
Individual: A single member of the population or sample.
Example: In a survey of 1013 adults in the United States, the population is all adults in the U.S., the sample is the 1013 surveyed adults, and each respondent is an individual.
Parameters and Statistics
Distinguishing Population and Sample Measures
Statistical analysis often involves distinguishing between parameters and statistics:
Parameter: A numerical summary of a population (e.g., average points earned by all students at GSU).
Statistic: A numerical summary of a sample (e.g., average points earned by students in one math class).
Data: The values collected from individuals.
Types of Statistical Analysis
Descriptive vs. Inferential Statistics
Statistical analysis can be divided into two main types:
Descriptive Statistics: Methods for summarizing and organizing data.
Inferential Statistics: Methods for making predictions or inferences about a population based on sample data.
Probability and Common Statistical Terms
Probability, Mean, and Proportion
Probability is a mathematical tool used to study randomness and the likelihood of events. Two frequently used terms in statistics are:
Mean: The average value, calculated as the sum of values divided by the number of values.
Proportion: The fraction of the sample or population with a particular characteristic.
Example: If exam scores are 86, 75, and 92, the mean is $(\frac{86+75+92}{3} = 84.3)$.
Example: In a class of 40 students, 22 are men and 18 are women. The proportion of men is $(\frac{22}{40})$, and the proportion of women is $(\frac{18}{40})$.
Variables and Data
Definitions and Classifications
Variables are characteristics of individuals in a population, and data are the values assigned to these variables.
Variable: A characteristic of interest, denoted by capital letters (e.g., X, Y).
Data: The observed values for variables.
Example: Variables: Name, Height, Siblings, Grade. Data: Sara, James; 5'8", 6'1"; 2, 1; B, C.
Types of Variables
Qualitative vs. Quantitative
Variables can be classified as qualitative (categorical) or quantitative (numerical):
Qualitative (Categorical): Classifies individuals based on attributes or characteristics. Arithmetic operations are meaningless. Examples: Name, Grade.
Quantitative: Provides numerical measures. Arithmetic operations are meaningful. Examples: Height, Siblings.
Further Classification of Variables
Qualitative Variables:
Nominal: Categories with no meaningful order (e.g., Name).
Ordinal: Categories with a meaningful order (e.g., Grade).
Quantitative Variables:
Discrete: Values are separate and distinct (e.g., Siblings).
Continuous: Values can take any value within a range (e.g., Height).
Summary Table: Variable Types and Examples
Variable | Type | Subtype | Example |
|---|---|---|---|
Name | Qualitative | Nominal | Sara |
Grade | Qualitative | Ordinal | B |
Siblings | Quantitative | Discrete | 2 |
Height | Quantitative | Continuous | 5'8" |
Data Collection Methods
Census vs. Sample Data
Data can be collected from every individual in a population (census) or from a sample.
Census: Collection of data from every individual in the population.
Sample Data: Collection of data from a subset of the population.
Normal Distribution Example
Application to Tire Warranty Problem
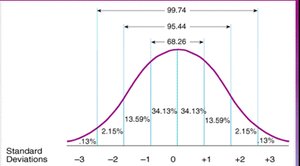
Suppose a tire manufacturer finds that tire lifespans are normally distributed with a mean of 60,000 miles and a standard deviation of 4,000 miles. Questions about warranty involve understanding the normal distribution:
Should they warrant tires for 60,000 miles? Since 60,000 is the mean, about half of tires will fail before this mileage.
Warranty at 52,000 miles: Calculate the percentage of tires expected to fail before 52,000 miles using the normal distribution.
Warranty for 5% failure: Find the mileage corresponding to the 5th percentile of the normal distribution.
Normal Distribution Formula:
$ P(X < x) = \frac{1}{\sigma \sqrt{2\pi}} \int_{-\infty}^{x} e^{-\frac{(t-\mu)^2}{2\sigma^2}} dt $
Designing a Statistical Study
Example: Toothpaste Additive Study
To compare a toothpaste with an additive to one without, plaque levels are measured on a scale of 0 to 10. The study aims for a 95% confidence level and a margin of error less than 0.2.
Process: Randomly assign subjects to two groups, collect plaque measurements, and analyze the difference.
Sample Size Calculation: Use the formula for margin of error in confidence intervals:
$ E = z_{\alpha/2} \frac{\sigma}{\sqrt{n}} $
Where $E$ is the margin of error, $z_{\alpha/2}$ is the critical value for 95% confidence, $\sigma$ is the estimated standard deviation, and $n$ is the sample size.
Histograms and Data Visualization
Understanding Data Distribution
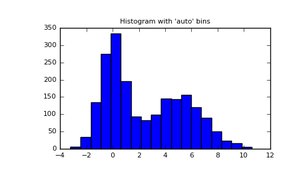
Histograms are used to visualize the distribution of data, showing the frequency of values within specified intervals (bins).
Histogram: A graphical representation of the distribution of numerical data.
Bins: Intervals that group data values.
Binomial Distribution
Probability Distribution for Discrete Random Variables
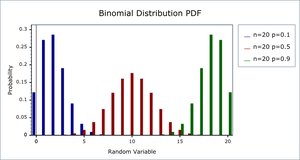
The binomial distribution models the probability of a fixed number of successes in a fixed number of independent trials, each with the same probability of success.
Parameters: $n$ (number of trials), $p$ (probability of success).
Probability Mass Function:
$ P(X = k) = \binom{n}{k} p^k (1-p)^{n-k} $
Summary
This guide covers foundational concepts in statistics, including populations, samples, parameters, statistics, types of variables, data collection, probability, and key distributions. Understanding these concepts is essential for further study in statistics and for applying statistical methods to real-world problems.
