 Back
Introduction to Statistics: Populations, Samples, and the Statistical Study Process
Study Guide - Smart Notes
 Tailored notes based on your materials, expanded with key definitions, examples, and context.
Section 1.1: What Is/Are Statistics?
Populations, Samples, Sample Statistics, and Population Parameters
Statistics is the science of collecting, analyzing, and interpreting data. It provides tools for understanding information and making informed decisions based on data. In statistics, it is crucial to distinguish between populations, samples, sample statistics, and population parameters.
Population: The complete set of people or things being studied in a statistical investigation.
Population Parameter: A specific characteristic or numerical summary of a population (e.g., mean, proportion).
Sample: A subset of the population from which data are actually collected.
Sample Statistic: A number describing a characteristic of the sample, calculated from the collected data.
Example 1: The U.S. Labor Department surveys 60,000 households to estimate the unemployment rate.
Population: All people in the civilian labor force.
Population Parameter: The true unemployment rate among the entire civilian labor force.
Sample: The 60,000 surveyed households.
Sample Statistic: The unemployment rate calculated from the survey responses.
Example 2: A study of 106 adults found their average body temperature was 98.2°F.
Population: All adult humans (or all adults in the relevant context).
Population Parameter: The true mean body temperature of all adults.
Sample: The 106 adults studied.
Sample Statistic: The mean body temperature of 98.2°F calculated from the sample.
Margin of Error and Confidence Interval
When using sample statistics to estimate population parameters, there is always some uncertainty. The margin of error quantifies the amount by which a sample statistic may differ from the population parameter. A confidence interval provides a range of values likely to contain the population parameter.
Margin of Error: The maximum expected difference between the sample statistic and the true population parameter.
Confidence Interval: The range of values, calculated as the sample statistic plus or minus the margin of error, likely to contain the population parameter.
Formulas:
Lower bound:
Upper bound:
A 95% confidence interval means that if the study were repeated many times, about 95% of the calculated intervals would contain the true population parameter.
Example 1: In a poll of 1501 adults, 77% said global warming is already harming people, with a margin of error of 2 percentage points. Confidence Interval: Interpretation: We are 95% confident that between 75% and 79% of all adults in Latin America believe global warming is already harming people.
Example 2: In a poll of 1289 adults, 57% opposed teachers carrying guns in school, with a margin of error of 4 percentage points. Confidence Interval: Interpretation: We are 95% confident that between 53% and 61% of all adults nationwide oppose teachers carrying guns in school.
Statistical Study Process
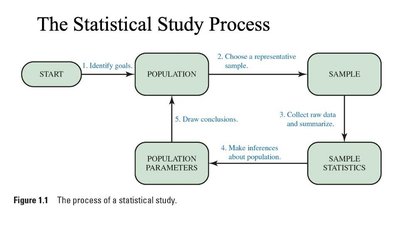
The statistical study process is a systematic approach to collecting and analyzing data to answer questions about a population. It consists of five basic steps:
Identify goals: Clearly state the objective of the study and define the population of interest.
Choose a representative sample: Select a sample that accurately reflects the population.
Collect data and summarize: Gather raw data from the sample and compute relevant sample statistics.
Make inferences: Use the sample statistics to draw conclusions about the population parameters.
Draw conclusions: Interpret the results and determine whether the study's goals were achieved.
Example: The Pew Research Center surveyed 1002 adults about the reasons for an increase in sex scandals among elected officials. 57% attributed it to greater media scrutiny (margin of error: 3 percentage points).
Population: All adult Americans.
Sample: The 1002 adults surveyed.
Sample Statistic: 57% believed the increase was due to greater media scrutiny.
Confidence Interval:
Conclusion: We are 95% confident that between 54% and 60% of all adult Americans believe the increase is due to greater media scrutiny.
Application of the Five Steps:
Goals: Determine why there is an increase in sex scandals among elected officials.
Sample: Select a representative sample of 1002 adult Americans.
Data Collection: Survey the sample and summarize the responses (e.g., 57% attribute to media scrutiny).
Inference: Use the sample statistic to estimate the proportion in the entire population.
Conclusion: Conclude that a majority of Americans likely attribute the increase to media scrutiny, within the margin of error.
