 Back
Introduction to the Practice of Statistics: Data Collection and Classification
Study Guide - Smart Notes
 Tailored notes based on your materials, expanded with key definitions, examples, and context.
1. Introduction to the Practice of Statistics
1.1 What is Statistics?
Statistics is the science of collecting, organizing, summarizing, and analyzing information to draw conclusions or answer questions. It also involves providing a measure of confidence in any conclusions drawn from data.
Data: Facts or propositions used to draw conclusions or make decisions. Data can come from observations, counts, measurements, or responses.
Importance of Data Collection: The way data is collected affects the validity of conclusions. For example, voluntary response samples (such as radio call-in polls) may not represent the entire population.
Generalization: Conclusions should not be extended beyond the group actually studied. For example, results from high school students may not apply to college students.
Variability: Data often varies, and understanding this variability is a key goal of statistics.
1.2 Populations and Samples
In statistics, we often study a population (the entire group of interest) or a sample (a subset of the population).
Population: The entire group of individuals to be studied.
Sample: A subset of the population, used when studying the whole population is impractical.
Example: In a survey of 1708 U.S. adults about global warming, the population is all U.S. adults, the sample is the 1708 surveyed, and the data set consists of their responses (e.g., 939 yes, 769 no).
1.3 Parameters and Statistics
Parameter: A numerical summary of a population.
Statistic: A numerical summary of a sample.
Example: If 32% of 1300 surveyed high school students report being bullied, 32% is a statistic. If 48% of all NVCC students own a car, 48% is a parameter.
1.4 Branches of Statistics
Descriptive Statistics: Organizing, summarizing, and displaying data (e.g., tables, charts, averages).
Inferential Statistics: Using sample data to make generalizations about a population and measure reliability.
1.5 The Process of Statistics
Identify the Research Objective: Clearly state what you want to learn about the population.
Collect the Data: Ensure the sample is representative and data collection methods are appropriate.
Describe the Data: Use descriptive statistics to summarize the data.
Perform Inference: Use inferential statistics to draw conclusions about the population and report reliability (e.g., margin of error, confidence level).
Example: In a Gallup survey, 35% of 1017 adults believe the government wastes at least 51 cents of each tax dollar. The margin of error is 4% at a 95% confidence level.
2. Variables and Their Classification
2.1 Types of Variables
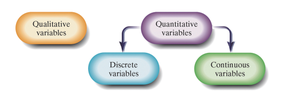
Variables are characteristics of individuals in a population. They can be classified as follows:
Qualitative (Categorical) Variables: Classify individuals based on attributes or characteristics (e.g., gender, race, zip code).
Quantitative Variables: Provide numerical measures. Values can be added or subtracted meaningfully (e.g., height, weight, age).
2.2 Discrete and Continuous Variables
Discrete Variables: Quantitative variables with a finite or countable number of possible values (e.g., number of siblings, number of cars).
Continuous Variables: Quantitative variables with an infinite number of possible values, measurable to any desired accuracy (e.g., height in inches, weight in pounds, time in hours).
2.3 Classifying Variables: Examples
Student ID: Qualitative (categorical, as it identifies but does not measure).
Salary of City Employees: Quantitative, continuous.
Number on Football Jersey: Qualitative (serves as a label, not a measurement).
Number of Siblings: Quantitative, discrete.
Nationality: Qualitative.
Gas Mileage: Quantitative, continuous.
Grade Earned in Algebra (%): Quantitative, continuous.
3. Application: Identifying Individuals and Variables in a Data Set
3.1 Example: Driver’s License Laws Data
The following table presents data on driver’s license laws for various states. Each row represents a state (the individual), and the columns represent variables:
State | Minimum Age for Driver’s License (unrestricted) | Mandatory Belt Use Seating Positions | Maximum Allowable Speed Limit (cars on rural interstate), mph |
|---|---|---|---|
Alabama | 17 | All | 70 |
Colorado | 17 | Front | 75 |
Indiana | 18 | All | 70 |
North Carolina | 16 | All | 70 |
Wisconsin | 18 | All | 70 |
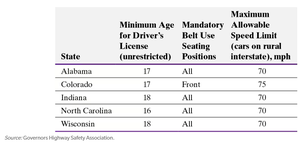
Individuals: States (Alabama, Colorado, etc.)
Variables: Minimum age (quantitative, discrete), mandatory belt use (qualitative), maximum speed limit (quantitative, discrete)
4. Key Formulas and Concepts
Sample Proportion: Where is the number of successes in the sample, and is the sample size.
Margin of Error (for proportions): Where is the critical value for the desired confidence level.
Additional info: These formulas are foundational for making inferences about populations based on sample data.
