 Back
Introductory Statistics: Association, Correlation, and Regression Study Guidance
Study Guide - Smart Notes
 Tailored notes based on your materials, expanded with key definitions, examples, and context.
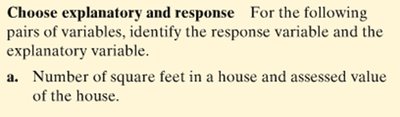
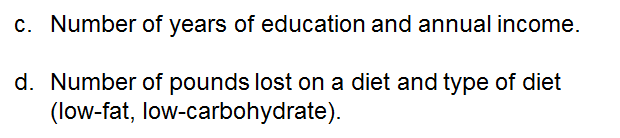
Q1. For the following pairs of variables, identify the response variable and the explanatory variable:
Number of square feet in a house and assessed value of the house.
Number of years of education and annual income.
Number of pounds lost on a diet and type of diet (low-fat, low-carbohydrate).
Background
Topic: Response and Explanatory Variables
This question tests your understanding of how to distinguish between the response variable (the outcome you are interested in) and the explanatory variable (the factor that might influence the outcome) in a study.
Key Terms:
Response Variable (Dependent Variable): The variable you want to explain or predict.
Explanatory Variable (Independent Variable): The variable you think influences or explains changes in the response variable.
Step-by-Step Guidance
For each pair, ask yourself: "Which variable is the outcome or result, and which is the factor that might cause or influence that outcome?"
Consider the context: For example, does the number of square feet in a house determine its value, or does the value determine the size?
Apply the same reasoning to the other pairs: For education and income, think about which is likely to influence the other.
For the diet question, decide whether the type of diet influences the pounds lost, or vice versa.
Set up your answers by labeling each variable as either explanatory or response, but stop before stating the final labels for each pair.
Try solving on your own before revealing the answer!
Final Answer:
Number of square feet in a house is the explanatory variable; assessed value of the house is the response variable.
Number of years of education is the explanatory variable; annual income is the response variable.
Type of diet is the explanatory variable; number of pounds lost is the response variable.
In each case, the explanatory variable is the factor that might influence the outcome, while the response variable is the outcome being measured.
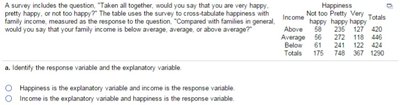
Q2. Identify the response variable and the explanatory variable in a survey about happiness and income.
Background
Topic: Response and Explanatory Variables in Contingency Tables
This question tests your ability to identify which variable is the response and which is explanatory in a cross-tabulation (contingency table) context.
Key Terms:
Contingency Table: A table showing the frequency distribution of variables.
Response Variable: The variable you are interested in explaining.
Explanatory Variable: The variable that might influence the response.
Step-by-Step Guidance
Read the survey question carefully: It asks about happiness levels and relates them to income categories.
Determine which variable is being measured as the outcome (happiness) and which is being used to group respondents (income).
Think about which variable is likely to influence the other: Does income affect happiness, or does happiness affect income?
Set up your answer by identifying which is the response and which is the explanatory variable, but stop before stating the final answer.
Try solving on your own before revealing the answer!
Final Answer:
Income is the explanatory variable and happiness is the response variable.
We are interested in how income levels might influence happiness, so happiness is the outcome being measured.
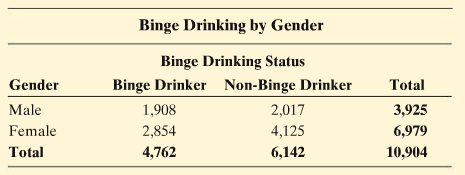
Q3. Report the cell counts of subjects who were (i) male and a binge drinker, (ii) female and a binge drinker.
Background
Topic: Contingency Tables and Cell Counts
This question tests your ability to read and interpret cell counts from a contingency table, which is a fundamental skill in statistics for analyzing categorical data.
Key Terms:
Contingency Table: A table that displays the frequency of combinations of two categorical variables.
Cell Count: The number of observations in a specific category combination.
Step-by-Step Guidance
Locate the row for "Male" and the column for "Binge Drinker" in the table.
Find the cell count at the intersection of these categories.
Repeat the process for "Female" and "Binge Drinker."
Record the cell counts for both combinations, but stop before stating the final numbers.
Try solving on your own before revealing the answer!
Final Answer:
Male and binge drinker: 1,908
Female and binge drinker: 2,854
These are the cell counts from the contingency table for each gender and binge drinking status.
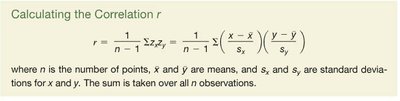
Q4. Calculating the correlation coefficient r: What is the formula for r and what does it measure?
Background
Topic: Correlation Coefficient
This question tests your understanding of the formula for the correlation coefficient and its interpretation in statistics.
Key Terms and Formula:
Correlation Coefficient (r): Measures the strength and direction of a linear relationship between two quantitative variables.
Formula:
= number of points
and = means of x and y
and = standard deviations for x and y
Step-by-Step Guidance
Understand that r measures how closely the data points follow a straight line.
Recall that r ranges from -1 (perfect negative linear relationship) to +1 (perfect positive linear relationship).
Review the formula and identify each component: means, standard deviations, and z-scores.
Think about how you would calculate r for a given dataset, but stop before performing any calculations.
Try solving on your own before revealing the answer!
Final Answer:
The formula for the correlation coefficient r is:
It measures the strength and direction of the linear relationship between two quantitative variables.
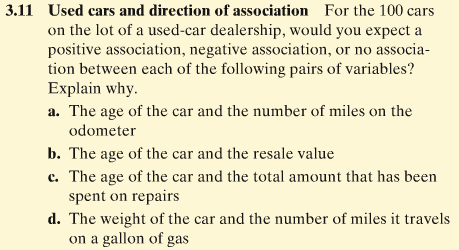
Q5. For the 100 cars on the lot of a used-car dealership, would you expect a positive association, negative association, or no association between each of the following pairs of variables? Explain why.
The age of the car and the number of miles on the odometer
The age of the car and the resale value
The age of the car and the total amount that has been spent on repairs
The weight of the car and the number of miles it travels on a gallon of gas
Background
Topic: Direction of Association
This question tests your ability to reason about the expected direction of association (positive, negative, or none) between pairs of quantitative variables.
Key Terms:
Positive Association: As one variable increases, the other tends to increase.
Negative Association: As one variable increases, the other tends to decrease.
No Association: No clear trend between the variables.
Step-by-Step Guidance
For each pair, consider the logical relationship: Does increasing one variable tend to increase or decrease the other?
Think about real-world examples: Older cars usually have more miles, lower resale value, and more repairs.
For weight and gas mileage, consider whether heavier cars tend to get fewer miles per gallon.
Set up your answers by reasoning through each pair, but stop before stating the final association direction.
Try solving on your own before revealing the answer!
Final Answer:
Age and miles: Positive association (older cars have more miles).
Age and resale value: Negative association (older cars have lower value).
Age and repairs: Positive association (older cars have more repairs).
Weight and miles per gallon: Negative association (heavier cars get fewer miles per gallon).
Each association is based on logical reasoning about how the variables relate in real-world situations.
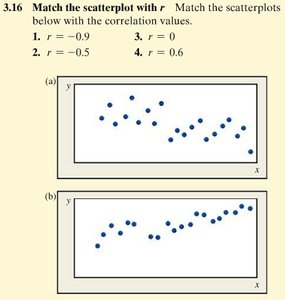
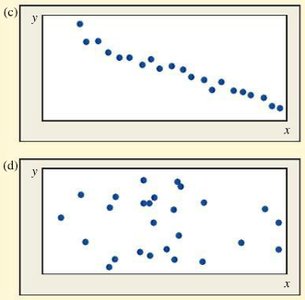
Q6. Match the scatterplots with the correlation values: r = -0.9, r = -0.5, r = 0, r = 0.6
Background
Topic: Scatterplots and Correlation
This question tests your ability to visually interpret scatterplots and match them to the correct correlation values based on the strength and direction of the linear relationship.
Key Terms:
Scatterplot: A graph of points showing the relationship between two quantitative variables.
Correlation (r): Indicates the strength and direction of the linear relationship.
Step-by-Step Guidance
Examine each scatterplot for the direction (positive or negative) and strength (how close the points are to a straight line).
Recall that r values close to +1 or -1 indicate strong linear relationships, while values near 0 indicate weak or no linear relationship.
Match the scatterplots to the correlation values based on these characteristics, but stop before stating the final matches.
Try solving on your own before revealing the answer!
Final Answer:
(a) r = 0.6
(b) r = -0.5
(c) r = -0.9
(d) r = 0
Strong negative correlation is shown in (c), moderate negative in (b), moderate positive in (a), and no correlation in (d).
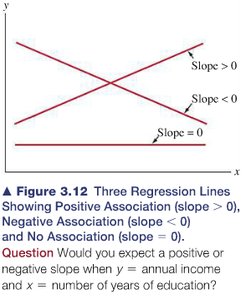
Q7. Would you expect a positive or negative slope when y = annual income and x = number of years of education?
Background
Topic: Regression Line and Slope
This question tests your understanding of the meaning of the slope in a regression equation and how it relates to the association between two variables.
Key Terms:
Regression Line: A straight line that best fits the data in a scatterplot.
Slope: Indicates how much y changes for each unit increase in x.
Positive Slope: y increases as x increases.
Negative Slope: y decreases as x increases.
Step-by-Step Guidance
Consider the relationship between education and income: Does more education typically lead to higher income?
Recall that a positive slope means y increases as x increases, while a negative slope means y decreases as x increases.
Set up your answer by reasoning about the expected direction of the slope, but stop before stating the final answer.
Try solving on your own before revealing the answer!
Final Answer:
You would expect a positive slope when y = annual income and x = number of years of education.
This is because, generally, more years of education are associated with higher annual income.
