 Back
Introductory Statistics: Association, Correlation, and Regression Study Guide
Study Guide - Smart Notes
 Tailored notes based on your materials, expanded with key definitions, examples, and context.
Q1. For the following pairs of variables, identify the response variable and the explanatory variable:
Number of square feet in a house and assessed value of the house.
Number of years of education and annual income.
Number of pounds lost on a diet and type of diet (low-fat, low-carbohydrate).
Background
Topic: Response and Explanatory Variables
This question tests your understanding of how to distinguish between response (dependent) and explanatory (independent) variables in a study. The response variable is the outcome you are interested in, while the explanatory variable is the factor you think influences the outcome.
Key Terms:
Response Variable (Dependent Variable): The variable you measure or observe as the outcome.
Explanatory Variable (Independent Variable): The variable you think affects or explains changes in the response variable.
Step-by-Step Guidance
For each pair, ask yourself: "Which variable is the outcome or result, and which is the factor that might influence it?"
Consider the context: For example, does the number of square feet in a house determine its value, or does the value determine the size?
Apply the same reasoning to the other pairs: Is annual income affected by years of education, or vice versa? Is weight loss affected by the type of diet?
Write down which variable is the response and which is explanatory for each pair, but stop before stating the final answer.
Try solving on your own before revealing the answer!
Final Answer:
Number of square feet is the explanatory variable; assessed value is the response variable.
Number of years of education is the explanatory variable; annual income is the response variable.
Type of diet is the explanatory variable; number of pounds lost is the response variable.
In each case, the explanatory variable is the factor that is thought to influence the outcome (response variable).
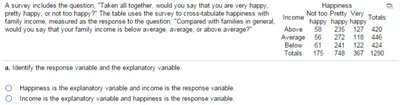
Q2. Identify the response variable and the explanatory variable in a survey about happiness and income.
Background
Topic: Response and Explanatory Variables in Contingency Tables
This question is about identifying which variable is the outcome and which is the influencing factor in a cross-tabulation of happiness and income.
Key Terms:
Contingency Table: A table showing the frequency distribution of variables.
Response Variable: The variable you are measuring as the outcome.
Explanatory Variable: The variable you think affects the response.
Step-by-Step Guidance
Read the survey question carefully: Is happiness being measured as the outcome, or is income?
Look at how the table is structured: Which variable is being grouped by the other?
Think about which variable is likely to influence the other in this context.
Decide which is the response and which is explanatory, but stop before stating the final answer.
Try solving on your own before revealing the answer!
Final Answer:
Income is the explanatory variable and happiness is the response variable.
The survey is measuring happiness as the outcome, based on different levels of income.
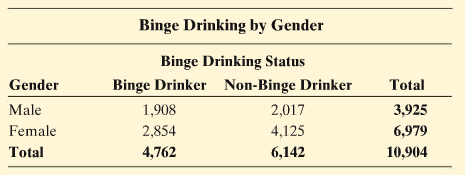
Q3. Report the cell counts of subjects who were (i) male and a binge drinker, (ii) female and a binge drinker.
Background
Topic: Contingency Tables and Cell Counts
This question tests your ability to read and interpret cell counts from a contingency table, which is a fundamental skill in statistics for analyzing categorical data.
Key Terms:
Cell Count: The number of observations in a specific category combination in a contingency table.
Binge Drinker: A category in the table.
Gender: Another category in the table.
Step-by-Step Guidance
Locate the row for "Male" and the column for "Binge Drinker" in the table.
Find the cell count at the intersection of these categories.
Repeat the process for "Female" and "Binge Drinker."
Write down the cell counts, but stop before stating the final answer.
Try solving on your own before revealing the answer!
Final Answer:
Male and binge drinker: 1,908
Female and binge drinker: 2,854
These are the cell counts from the contingency table for each gender and binge drinking status.
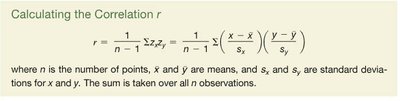
Q4. Calculating the Correlation r: What is the formula for the correlation coefficient r?
Background
Topic: Correlation Coefficient
This question is about understanding the formula for the correlation coefficient, which measures the strength and direction of a linear relationship between two quantitative variables.
Key Terms and Formula:
Correlation (r): A measure of linear association between two variables.
Formula:
= number of points
and = means
and = standard deviations
Step-by-Step Guidance
Understand that the formula standardizes each variable by subtracting the mean and dividing by the standard deviation.
Multiply the standardized values for each pair of observations.
Sum these products over all observations.
Divide by to get the correlation coefficient, but stop before calculating the final value.
Try solving on your own before revealing the answer!
Final Answer:
The formula for the correlation coefficient is:
This formula measures how much the variables co-vary, standardized by their means and standard deviations.
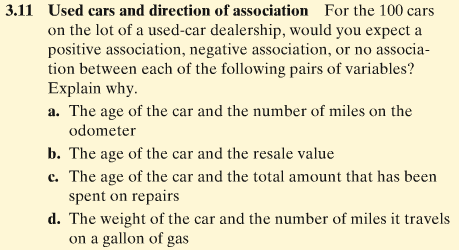
Q5. For the 100 cars on the lot of a used-car dealership, would you expect a positive association, negative association, or no association between each of the following pairs of variables? Explain why.
The age of the car and the number of miles on the odometer
The age of the car and the resale value
The age of the car and the total amount that has been spent on repairs
The weight of the car and the number of miles it travels on a gallon of gas
Background
Topic: Direction of Association
This question tests your ability to predict the direction of association (positive, negative, or none) between pairs of variables based on logical reasoning and statistical concepts.
Key Terms:
Positive Association: As one variable increases, the other tends to increase.
Negative Association: As one variable increases, the other tends to decrease.
No Association: No consistent relationship between the variables.
Step-by-Step Guidance
For each pair, consider how the variables are likely to relate: Does increasing one cause the other to increase or decrease?
Think about real-world examples: Older cars usually have more miles, but their resale value may decrease.
Apply reasoning to each pair, but stop before stating the final answer.
Try solving on your own before revealing the answer!
Final Answer:
Age and miles: Positive association (older cars have more miles).
Age and resale value: Negative association (older cars have lower value).
Age and repairs: Positive association (older cars need more repairs).
Weight and miles per gallon: Negative association (heavier cars get fewer miles per gallon).
Each association is based on logical relationships between the variables.
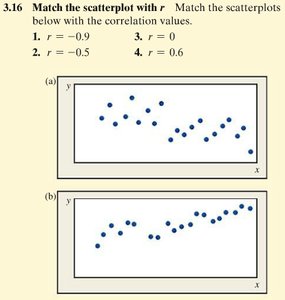
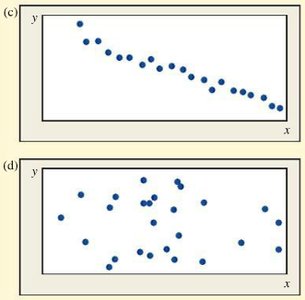
Q6. Match the scatterplots with the correlation values: r = -0.9, r = -0.5, r = 0, r = 0.6
Background
Topic: Interpreting Scatterplots and Correlation
This question tests your ability to visually interpret scatterplots and match them to the correct correlation values, which indicate the strength and direction of linear relationships.
Key Terms:
Scatterplot: A graph showing the relationship between two quantitative variables.
Correlation (r): Indicates strength and direction of linear association.
Step-by-Step Guidance
Examine each scatterplot for the direction (positive or negative) and strength (how close points are to a line).
Recall: r close to -1 means strong negative, r close to +1 means strong positive, r near 0 means no association.
Match each plot to the value based on these characteristics, but stop before stating the final answer.
Try solving on your own before revealing the answer!
Final Answer:
(a) r = 0.6
(b) r = -0.5
(c) r = -0.9
(d) r = 0
Plots with points close to a line have stronger correlations; negative slopes correspond to negative r values.
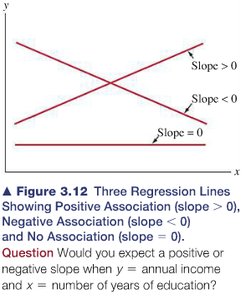
Q7. Would you expect a positive or negative slope when y = annual income and x = number of years of education?
Background
Topic: Regression Line and Slope
This question is about predicting the sign of the slope in a regression equation, which tells you whether the association between two variables is positive or negative.
Key Terms:
Regression Line: A line that best fits the data in a scatterplot.
Slope: Indicates how much y changes for each unit increase in x.
Positive Slope: y increases as x increases.
Negative Slope: y decreases as x increases.
Step-by-Step Guidance
Think about the relationship: Does more education typically lead to higher income?
Recall that a positive slope means y increases as x increases.
Apply this reasoning to the context, but stop before stating the final answer.
Try solving on your own before revealing the answer!
Final Answer:
You would expect a positive slope, because as the number of years of education increases, annual income tends to increase.
This reflects a positive association between education and income.
