Back
Introductory Statistics: Core Concepts and Methods
Study Guide - Smart Notes
 Tailored notes based on your materials, expanded with key definitions, examples, and context.
Introduction to Statistics
What is Statistics?
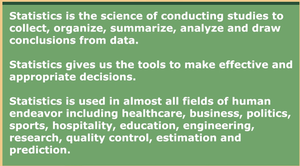
Statistics is the science of conducting studies to collect, organize, summarize, analyze, and draw conclusions from data. It provides essential tools for making effective and appropriate decisions in various fields such as healthcare, business, politics, sports, engineering, and more.
Collecting Data
Types of Studies
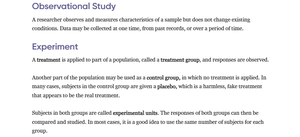
Observational Study: The researcher observes and measures characteristics of a sample but does not change existing conditions. Data may be collected at one time, from past records, or over a period of time.
Experiment: A treatment is applied to part of a population (treatment group), and responses are observed. A control group may receive a placebo (a harmless, fake treatment). Subjects in both groups are called experimental units. Comparing responses helps determine the effect of the treatment.
Methods of Data Collection
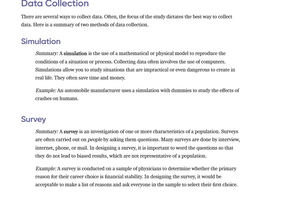
Simulation: Uses mathematical or physical models to reproduce conditions of a situation or process. Useful for situations that are impractical or dangerous to create in real life. Example: An automobile manufacturer uses simulations with dummies to study crash effects.
Survey: An investigation of one or more characteristics of a population, often by asking questions. Surveys can be conducted via interviews, internet, phone, or mail. Example: A survey of physicians to determine their preferred treatment methods.
Describing Data with Tables and Graphs
Frequency Distribution Construction
To organize raw data, a frequency distribution is constructed by following these steps:
List all raw data values.
Find the minimum and maximum values to compute the range:
Choose the number of classes (typically 5–10).
Compute class width: (round up if necessary)
Create class limits for each class interval.
Tally and count frequencies for each class.
Compute midpoints:
Compute relative frequencies:
Compute cumulative frequencies by adding frequencies sequentially.
For continuous data, compute class boundaries: Lower boundary = lower limit − 0.5, Upper boundary = upper limit + 0.5
Key Table Structure:
Class # | Lower limit | Upper limit | Frequency (f) | Midpoint | Relative freq | Cumulative freq | Boundaries |
|---|---|---|---|---|---|---|---|
1 | ____ | ____ | ____ | ____ | ____ | ____ | ____ – ____ |
2 | ____ | ____ | ____ | ____ | ____ | ____ | ____ – ____ |
... | ... | ... | ... | ... | ... | ... | ... |
Key Definitions
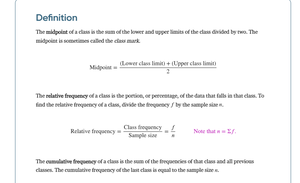
Midpoint (Class Mark):
Relative Frequency: , where is class frequency and is sample size.
Cumulative Frequency: The sum of the frequencies for that class and all previous classes.
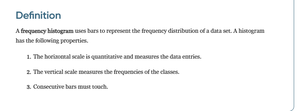
Frequency Histogram
A frequency histogram uses bars to represent the frequency distribution of a data set. Properties:
The horizontal scale is quantitative and measures data entries.
The vertical scale measures class frequencies.
Consecutive bars must touch.
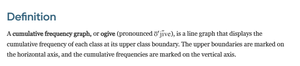
Cumulative Frequency Graph (Ogive)
An ogive is a line graph displaying the cumulative frequency of each class at its upper class boundary. The horizontal axis marks upper boundaries, and the vertical axis marks cumulative frequencies.
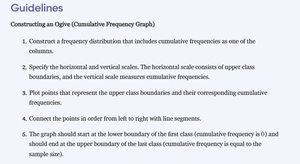
Constructing an Ogive
Construct a frequency distribution with cumulative frequencies.
Specify horizontal (upper class boundaries) and vertical (cumulative frequencies) scales.
Plot points for each upper class boundary and corresponding cumulative frequency.
Connect points with line segments.
Start at the lower boundary of the first class (cumulative frequency = 0) and end at the upper boundary of the last class (cumulative frequency = sample size).
Describing Data Numerically
Measures of Central Tendency
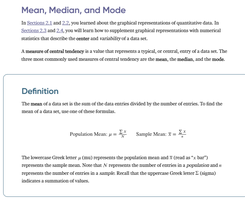
Measures of central tendency describe the center of a data set. The most common are the mean, median, and mode.
Mean: The sum of all data entries divided by the number of entries. Population Mean: Sample Mean:
Weighted Mean
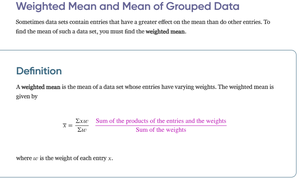
For data sets where entries have varying weights, the weighted mean is used:
, where is the value and is its weight.
Measures of Variation
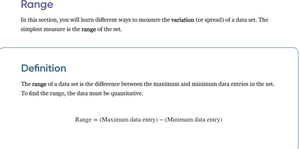
Variation describes the spread of data. The simplest measure is the range:
Quantitative Data
Quantitative data is measurable or countable, such as height, weight, salary, age, and time. Each value represents a quantity.

Variance and Standard Deviation
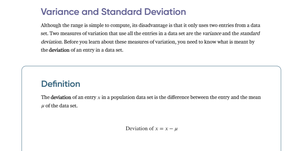
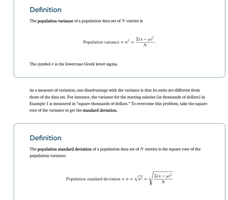
Variance and standard deviation are measures of how much data values deviate from the mean.
Deviation: (for population data)
Population Variance:
Population Standard Deviation:
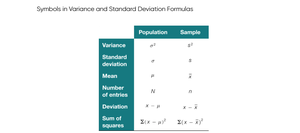
Symbols in Variance and Standard Deviation Formulas
Measure | Population | Sample |
|---|---|---|
Variance | ||
Standard deviation | ||
Mean | ||
Number of entries | ||
Deviation | ||
Sum of squares |
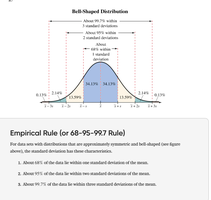
Empirical Rule (68-95-99.7 Rule)
For bell-shaped (normal) distributions:
About 68% of data lie within one standard deviation of the mean.
About 95% within two standard deviations.
About 99.7% within three standard deviations.
Probability
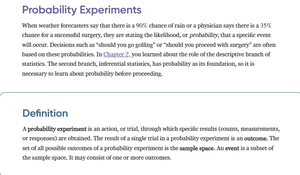
Probability Experiments
A probability experiment is an action or trial through which specific results (counts, measurements, or responses) are obtained. The result of a single trial is an outcome. The set of all possible outcomes is the sample space. An event is a subset of the sample space.
Identifying the Sample Space
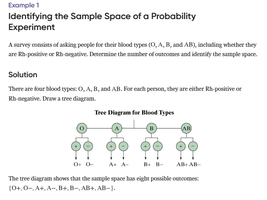
Example: A survey asks people for their blood types (O, A, B, AB) and Rh factor (positive or negative). The sample space consists of all possible combinations, shown in a tree diagram:
Possible outcomes: O+, O−, A+, A−, B+, B−, AB+, AB−