Back
Introductory Statistics: Displaying and Describing Data (Chapter 2 Study Guide)
Study Guide - Learn with Videos
 Curated lessons matched to your uploaded material – learn every topic step by step.
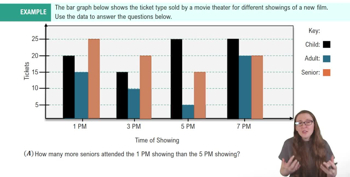
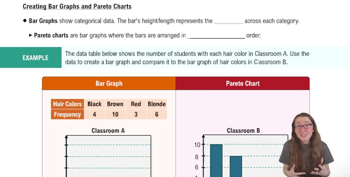
Bar Graphs and Pareto Charts
- Guided course
 05:26

- Guided course 04:52
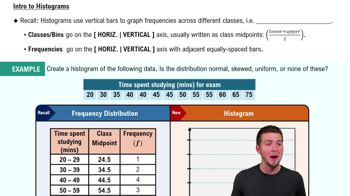
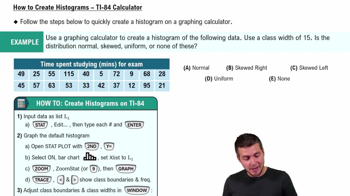
Histograms
- Guided course 05:54
- Guided course 07:10
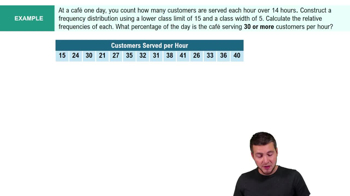
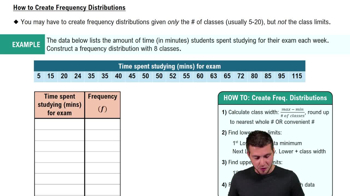
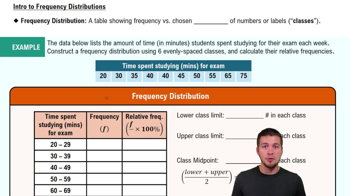
Frequency Distributions
- Guided course 06:19
- Guided course 06:29
- Guided course 06:38
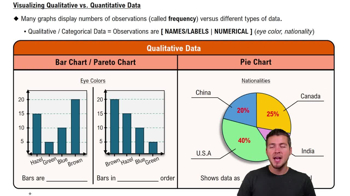
Visualizing Qualitative vs. Quantitative Data
- Guided course 04:39