 Back
Introductory Statistics Formula Sheet and Reference Tables
Study Guide - Smart Notes
 Tailored notes based on your materials, expanded with key definitions, examples, and context.
Chapter 2: Organizing and Summarizing Data
Relative Frequency
The relative frequency of a category is the proportion of observations within that category, calculated as:
Chapter 3: Numerically Summarizing Data
Measures of Central Tendency
Population Mean (μ):
Sample Mean (\(\bar{x}\)):
Measures of Dispersion
Sample Standard Deviation (s):
Population Standard Deviation (σ):
Sample Variance (s²):
Population Variance (σ²):
Empirical Rule (for Bell-Shaped Distributions)
Approximately 68% of the data lie within 1 standard deviation of the mean.
Approximately 95% of the data lie within 2 standard deviations of the mean.
Approximately 99.7% of the data lie within 3 standard deviations of the mean.
Measures of Position
Interquartile Range (IQR):
Lower Fence:
Upper Fence:
Five-Number Summary
Minimum, Q1, Median, Q3, Maximum
Chapter 4: Describing the Relation Between Two Variables
Correlation Coefficient (r)
The correlation coefficient measures the strength and direction of a linear relationship between two variables:
Chapter 5: Probability
Probability Rules
Classical Probability:
Empirical Probability:
Complement Rule:
Addition Rule for Disjoint Events:
General Addition Rule:
Multiplication Rule for Independent Events:
Conditional Probability:
Chapter 6: Discrete Probability Distributions
Mean and Standard Deviation of a Discrete Random Variable
Mean (Expected Value):
Standard Deviation:
Binomial Probability Distribution
Probability of x successes:
Mean:
Standard Deviation:
Chapter 7: The Normal Distribution
Standardizing a Normal Random Variable
Z-score:
Sampling Distributions
Mean of the Sampling Distribution of the Sample Mean:
Standard Deviation (Standard Error):
Mean of the Sampling Distribution of the Sample Proportion:
Standard Deviation:
Chapter 8 & 9: Confidence Intervals and Sample Size
Confidence Interval for a Population Proportion
Confidence Interval for a Population Mean (σ unknown)
Sample Size for Proportion
Sample Size for Mean
Chapter 10: Hypothesis Tests Regarding a Parameter
Test Statistic for a Population Mean (σ unknown)
Test Statistic for a Population Proportion
Chapter 11: Inferences on Two Samples
Test Statistic for Matched-Pairs Data
Test Statistic Comparing Two Population Proportions (Independent Samples)
Test Statistic Comparing Two Means (Independent Samples)
Chapter 12: Inference on Categorical Data
Chi-Square Test Statistic
Where O = observed count, E = expected count.
Expected Counts (Goodness-of-Fit)
Chapter 13: Comparing Three or More Means (ANOVA)
Test Statistic for One-Way ANOVA
Reference Tables
Random Number Table
Used for selecting random samples in statistical studies.
Critical Values for Correlation Coefficient and Normal Probability Plots
Sample Size (n) | Critical Value |
|---|---|
5 | 0.880 |
10 | 0.918 |
20 | 0.951 |
30 | 0.960 |
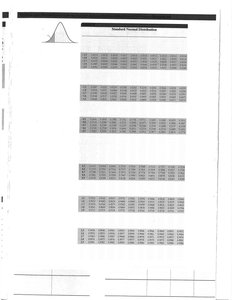
Standard Normal (Z) Table
Provides areas (probabilities) to the left of a given z-score under the standard normal curve.
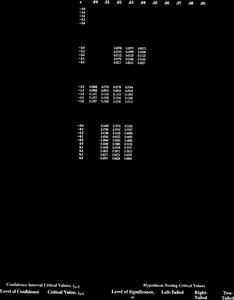
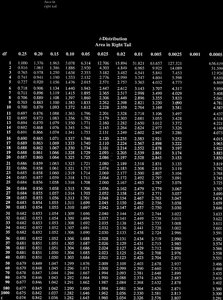
t-Distribution Table
Provides critical values for the t-distribution for various degrees of freedom and significance levels.
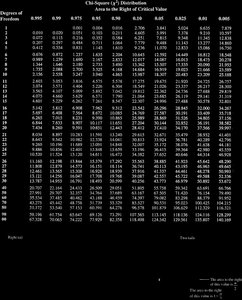
Chi-Square Distribution Table
Provides critical values for the chi-square distribution for various degrees of freedom and significance levels.
Chapter 2: Example of Frequency and Relative Frequency Tables
Body Part | Frequency |
|---|---|
Back | 12 |
Wrist | 2 |
Elbow | 1 |
Hip | 2 |
Shoulder | 4 |
Knee | 5 |
Hand | 2 |
Groin | 1 |
Neck | 1 |

Example Interpretation: The bar graph and pie chart above display the frequency and relative frequency of different types of rehabilitation required by patients. The most common body part requiring rehabilitation is the back, followed by the knee and shoulder.
Additional info: This formula sheet and table reference is a comprehensive summary of the key formulas, definitions, and tables used throughout an introductory statistics course, covering all major topics from data organization to hypothesis testing and ANOVA.
