 Back
Introductory Statistics: Foundations, Data, and Descriptive Analysis
Study Guide - Smart Notes
 Tailored notes based on your materials, expanded with key definitions, examples, and context.
Introduction to Statistics
What is Statistics?
Statistics is the science of learning from data. It involves collecting, analyzing, interpreting, and presenting data to support decision-making and scientific discovery. The field provides a framework for making inferences about populations based on samples, and for quantifying uncertainty in those inferences.
Descriptive Statistics: Summarizes and describes the features of a dataset (e.g., mean, median, mode, standard deviation).
Inferential Statistics: Uses data from a sample to make generalizations or predictions about a population.
Key Terms and Concepts
Data: Collected observations or measurements, which can be numerical or categorical.
Individuals (Cases): The objects described by a set of data (e.g., people, animals, plants, or things).
Population: The entire group of individuals or cases of interest.
Sample: A subset of the population, selected for analysis.
Variable: Any characteristic or attribute that can vary among individuals in a population (e.g., age, height, gender).
Populations, Samples, and Study Design
Populations and Samples
Understanding the distinction between populations and samples is fundamental in statistics:
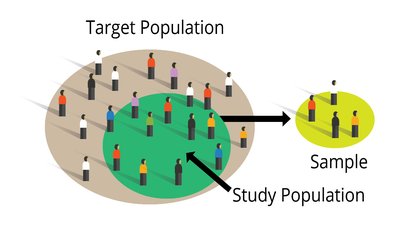
Target Population: The entire group about which researchers want to draw conclusions.
Study Population: The group from which the sample is actually drawn; often a subset of the target population.
Sample: The actual individuals selected for study.
Types of Populations
Finite Population: A countable, well-defined group (e.g., all students in a school).
Infinite Population: An uncountable or extremely large group (e.g., all possible future customers).
Sources of Error
Study Error: Occurs if the study population is not representative of the target population.
Sample Error: Occurs if the sample is not representative of the study population.
Types of Variables
Quantitative vs. Qualitative Variables
Quantitative (Numeric) Variables: Take numerical values; arithmetic operations make sense (e.g., height, age).
Discrete Variables: Can only take specific, separate values (e.g., number of children).
Continuous Variables: Can take any value within a range (e.g., weight, temperature).
Qualitative (Categorical) Variables: Take on categories or labels (e.g., gender, blood type).
Nominal Variables: Categories with no logical order (e.g., eye color).
Ordinal Variables: Categories with a meaningful order (e.g., clothing size: S, M, L).
Describing Data: Distributions, Tables, and Graphs
Distribution of a Variable
The distribution of a variable describes how its values are spread or distributed among individuals in the dataset. It can be summarized using tables, graphs, and numerical measures.
Key Characteristics of a Dataset
Who? The individuals described by the data.
What? The variables measured and their definitions.
Why? The purpose of the data collection.
Graphical Displays
Bar Graphs: Used for categorical data; each bar represents a category, and its height shows frequency or percentage.
Pie Charts: Show the proportion of each category as a slice of a circle; best for displaying parts of a whole.
Histograms: Used for quantitative data; show the distribution of data across intervals (bins).
Example Table: Distribution Table for Ice Cream Flavors
Flavor | Number of Cartons |
|---|---|
Chocolate | 16 |
Strawberry | 5 |
Vanilla | 9 |
Exploratory Data Analysis (EDA)
Key Dataset Characteristics
Shape: The overall pattern of the distribution (e.g., symmetric, skewed, unimodal, bimodal).
Center: The central tendency (e.g., mean, median).
Spread: The variability or dispersion (e.g., range, interquartile range, standard deviation).
Outliers: Observations that fall outside the overall pattern.
Visualizing Distributions
Histograms: Useful for large datasets to visualize the pattern of variability.
Frequency: The count of observations in each category or interval.
Relative Frequency: The proportion of observations in each category or interval.
Populations, Samples, and Sampling
Sampling Methods
Simple Random Sample (SRS): Every individual has an equal chance of being selected.
Stratified Random Sample: The population is divided into strata, and a random sample is taken from each stratum.
Multistage Sample: Sampling is done in stages, often combining several methods.
Sampling Bias
Selection Bias: Some groups are systematically excluded.
Volunteer Bias: Individuals who volunteer may differ from the general population.
Measurement Bias: The measurement process skews results.
Summary Table: Types of Variables
Type | Subtypes | Examples |
|---|---|---|
Quantitative | Discrete, Continuous | Number of children, Height |
Qualitative | Nominal, Ordinal | Gender, Academic grade |
Images
 (Relevant for visualizing data distributions and types of graphs in statistics)
