 Back
Introductory Statistics: Guided Study Notes and Step-by-Step Practice
Study Guide - Smart Notes
 Tailored notes based on your materials, expanded with key definitions, examples, and context.
Q1. What is the difference between a population and a sample in statistics?
Background
Topic: Populations and Samples
This question is testing your understanding of two foundational concepts in statistics: the population (the entire group you want to study) and the sample (a subset of that group from which you actually collect data).
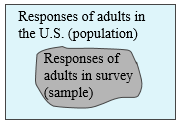
Key Terms:
Population: The complete collection of all individuals or items of interest.
Sample: A subset of the population, selected for actual analysis.
Step-by-Step Guidance
Read the definitions of population and sample carefully.
Think about why we often use samples instead of studying the entire population (consider time, cost, and practicality).
Look at the diagram: notice how the sample is a smaller group within the larger population.
Try to come up with your own example of a population and a sample in a real-world context (e.g., all students at a university vs. a group of 100 surveyed students).
Try solving on your own before revealing the answer!
Final Answer:
A population is the entire group of individuals or items that you want to study, while a sample is a subset of the population that is actually observed or analyzed. We use samples to make inferences about the population because it is often impractical to collect data from every member of the population.
Q2. Describe the shapes of distributions: symmetric (bell-shaped), skewed, and uniform.
Background
Topic: Describing the Shape of Distributions
This question is about recognizing and describing the overall shape of data distributions, which is important for understanding how data are spread and for choosing appropriate statistical methods.
Key Terms:
Symmetric (Bell-Shaped): The left and right sides of the distribution are roughly mirror images.
Skewed: The distribution stretches more to one side (right or left).
Uniform: All values have roughly the same frequency.
Step-by-Step Guidance
Review the definitions of symmetric, skewed, and uniform distributions.
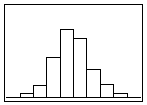
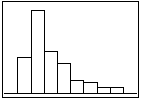
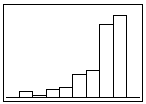
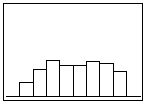
Look at the provided histograms and try to match each one to the correct description.
For a symmetric (bell-shaped) distribution, check if the highest frequencies are in the center and the sides taper off evenly.
For a skewed distribution, see if the data stretches more to the left (left-skewed) or right (right-skewed).
For a uniform distribution, check if the bars are all about the same height.
Try solving on your own before revealing the answer!
Final Answer:
Symmetric (bell-shaped): The distribution is highest in the center and tapers off equally on both sides (see image_2).
Left-skewed: The distribution has a longer tail on the left (see image_3).
Right-skewed: The distribution has a longer tail on the right (see image_4).
Uniform: All bars are about the same height, indicating equal frequencies (see image_5).
Recognizing these shapes helps you choose the right statistical methods and interpret data correctly.
Q3. What is a multiple bar graph, and how is it used in statistics?
Background
Topic: Bar Graphs and Multiple Bar Graphs
This question is about understanding how to visually compare two or more groups using bar graphs, which is a common way to display categorical data.
Key Terms:
Bar Graph: A chart with bars representing frequencies or relative frequencies of categories.
Multiple Bar Graph: A bar graph that displays two or more sets of data side by side for comparison.
Step-by-Step Guidance
Recall that a bar graph is used for categorical data, with each bar representing a category.
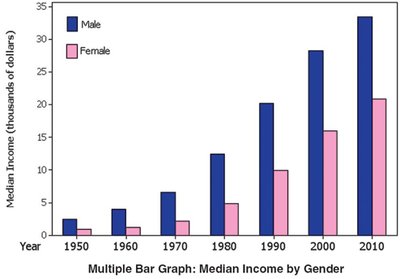
Understand that a multiple bar graph allows you to compare categories across different groups (e.g., male vs. female).
Look at the example graph and identify what is being compared (e.g., median income by gender over time).
Notice how each group (male, female) has its own color or pattern for easy comparison.
Try solving on your own before revealing the answer!
Final Answer:
A multiple bar graph is a type of bar graph that displays two or more sets of data side by side, allowing for direct comparison between groups (such as male and female median incomes over time). Each group is represented by a different color or pattern.
Q4. What is a Pareto chart, and how does it differ from a regular bar graph?
Background
Topic: Pareto Charts
This question is about a special type of bar graph used for qualitative data, where categories are ordered by frequency.
Key Terms:
Pareto Chart: A bar graph with categories arranged in descending order of frequency.
Bar Graph: A graph that shows frequencies of categories, but not necessarily in order.
Step-by-Step Guidance
Recall that a Pareto chart is used for qualitative (categorical) data.
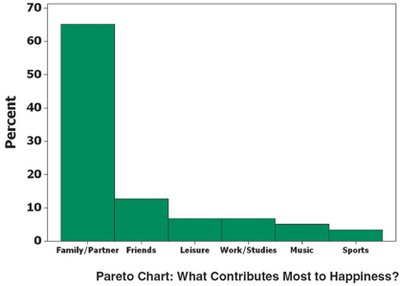
Understand that the bars are arranged from highest to lowest frequency.
Compare this to a regular bar graph, where the order of categories may not be based on frequency.
Look at the example and identify which category is most important or frequent.
Try solving on your own before revealing the answer!
Final Answer:
A Pareto chart is a bar graph in which the categories are arranged in descending order of frequency or importance. This makes it easy to see which categories are most significant. In contrast, a regular bar graph may not order the categories by frequency.
Q5. What is a pie chart, and when is it appropriate to use one?
Background
Topic: Pie Charts
This question is about understanding how to represent categorical data as parts of a whole using a circular graph.
Key Terms:
Pie Chart: A circular graph divided into slices, where each slice represents a category's proportion of the total.
Step-by-Step Guidance
Recall that a pie chart is used for categorical data, especially when you want to show how each category relates to the whole.
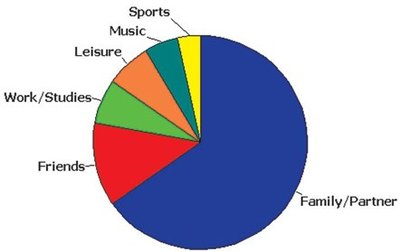
Each slice's size is proportional to the frequency or percentage of that category.
Look at the example and identify which category has the largest and smallest slices.
Think about situations where you want to emphasize the part-to-whole relationship (e.g., market share, survey responses).
Try solving on your own before revealing the answer!
Final Answer:
A pie chart is a circular graph divided into slices to illustrate numerical proportions. It is appropriate to use a pie chart when you want to show how each category contributes to the total, especially when the categories are parts of a whole.
Q6. What is a z-score, and how can you use it to determine if a value is unusual?
Background
Topic: Z-Scores (Standard Scores)
This question is about understanding how to standardize data values and identify unusual values in a data set.
Key Terms and Formula:
Z-score: The number of standard deviations a data value is from the mean.
Key formula:
= data value
= mean
= standard deviation
Step-by-Step Guidance
Recall the formula for the z-score and what each symbol represents.
Understand that z-scores tell you how far a value is from the mean in terms of standard deviations.
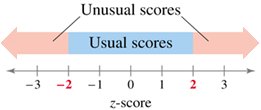
Values with z-scores less than -2 or greater than 2 are typically considered unusual.
Practice calculating a z-score for a given value, mean, and standard deviation, but stop before the final calculation.
Try solving on your own before revealing the answer!
Final Answer:
A z-score is calculated as . It tells you how many standard deviations a value is from the mean. Values with z-scores less than -2 or greater than 2 are considered unusual because they are far from the mean.
Q7. What is the Empirical Rule, and how does it describe the spread of data in a normal distribution?
Background
Topic: The Empirical Rule (68-95-99.7 Rule)
This question is about understanding how data are distributed in a normal (bell-shaped) distribution and how to use the Empirical Rule to estimate probabilities and ranges.
Key Terms:
Normal Distribution: A symmetric, bell-shaped distribution.
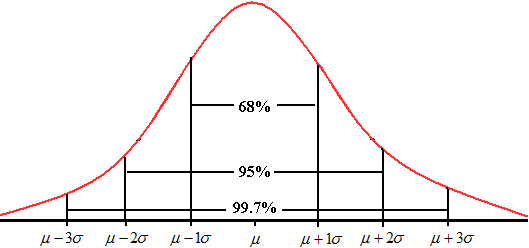
Empirical Rule: Describes the percentage of data within 1, 2, and 3 standard deviations of the mean.
Step-by-Step Guidance
Recall the percentages: about 68% of data fall within 1 standard deviation, 95% within 2, and 99.7% within 3.
Use the mean () and standard deviation () to calculate the intervals for each range.
For example, the interval for 68% is to .
Set up the calculations for each range, but stop before plugging in the final numbers.
Try solving on your own before revealing the answer!
Final Answer:
The Empirical Rule states that for a normal distribution: about 68% of values fall within 1 standard deviation of the mean, 95% within 2 standard deviations, and 99.7% within 3 standard deviations. This helps you quickly estimate the spread of data and identify unusual values.
