 Back
Introductory Statistics: Key Concepts and Study Guide
Study Guide - Smart Notes
 Tailored notes based on your materials, expanded with key definitions, examples, and context.
Statistics: Introduction and Overview
Definition and Purpose
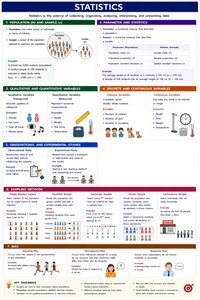
Statistics is the science of collecting, organizing, analyzing, interpreting, and presenting data. It is fundamental for making informed decisions based on data in various fields such as science, business, and social sciences.
Population and Sample
Definitions
Population: The entire group of individuals or items that we want to study.
Sample: A subset of the population selected for analysis.
Sampling Methods
Random Sampling: Every member of the population has an equal chance of being selected.
Systematic Sampling: Selecting every nth member from a list.
Stratified Sampling: Dividing the population into subgroups and sampling from each subgroup.
Cluster Sampling: Dividing the population into clusters and randomly selecting entire clusters.
Types of Data
Qualitative and Quantitative Variables
Qualitative (Categorical) Data: Describes qualities or categories (e.g., gender, color).
Quantitative Data: Numerical values that can be measured or counted.
Discrete and Continuous Variables
Discrete Variables: Take specific, separate values (e.g., number of students).
Continuous Variables: Can take any value within a range (e.g., height, weight).
Describing Data
Tables and Graphs
Frequency Tables: Summarize data by showing how often each value occurs.
Bar Graphs: Used for categorical data.
Histograms: Used for quantitative data.
Pie Charts: Show proportions of categories.
Measures of Central Tendency
Mean, Median, and Mode
Mean: The average value.
Median: The middle value when data is ordered.
Mode: The value that occurs most frequently.
Measures of Dispersion
Range, Variance, and Standard Deviation
Range: Difference between the highest and lowest values.
Variance: Measures the spread of data.
Standard Deviation: Square root of variance.
Probability
Basic Concepts
Probability: The likelihood of an event occurring, ranging from 0 (impossible) to 1 (certain).
Formula:
Discrete and Continuous Variables
Definitions and Examples
Discrete: Countable values (e.g., number of cars).
Continuous: Measurable values (e.g., temperature).
Sampling and Surveys
Types of Surveys
Simple Random Survey: Every member has an equal chance.
Systematic Survey: Selects at regular intervals.
Stratified Survey: Divides population into groups.
Cluster Survey: Uses entire groups as samples.
Data Collection Methods
Observational vs. Experimental Studies
Observational Study: Observes subjects without intervention.
Experimental Study: Applies treatment and observes effects.
Summary Table: Sampling Methods
The following table summarizes the main sampling methods and their characteristics:
Sampling Method | Description | Example |
|---|---|---|
Random | Equal chance for all | Lottery draw |
Systematic | Every nth item | Every 10th person |
Stratified | Groups by characteristics | By age group |
Cluster | Entire groups sampled | All students in a class |
Key Takeaways
Statistics involves collecting and analyzing data to make informed decisions.
Understanding types of data and sampling methods is crucial for accurate analysis.
Measures of central tendency and dispersion help describe and summarize data.
Probability quantifies uncertainty and is foundational for inferential statistics.
