 Back
Introductory Statistics Practice Test – Step-by-Step Study Guidance
Study Guide - Smart Notes
 Tailored notes based on your materials, expanded with key definitions, examples, and context.
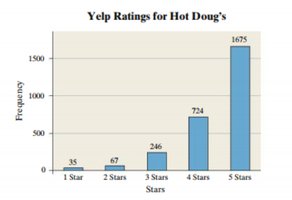
Q13. The following graph shows the ratings (1-5 stars) on Yelp for Hot Doug’s Restaurant. Label the x and y axis.
Background
Topic: Reading and Interpreting Graphs (Bar Charts/Histograms)
This question tests your ability to correctly identify and label the axes of a bar chart, which is a fundamental skill in descriptive statistics and data visualization.
Key Terms:
X-axis: The horizontal axis, typically representing categories or groups.
Y-axis: The vertical axis, usually representing frequency, count, or another quantitative measure.
Step-by-Step Guidance
Examine the horizontal axis (x-axis) of the graph. Notice the labels under each bar (e.g., 1 Star, 2 Stars, etc.).
Determine what these labels represent. In this case, they correspond to the number of stars in Yelp ratings, which are categories.
Look at the vertical axis (y-axis) and observe the numbers alongside it (e.g., 0, 500, 1000, 1500, 2000).
Consider what these numbers indicate. They show how many times each rating (1-5 stars) was given, which is the frequency of each category.
Based on this, decide on appropriate axis labels for both axes. The x-axis should reflect the rating categories, and the y-axis should reflect the frequency/count.
Try solving on your own before revealing the answer!
Final Answer:
X-axis label: Stars (or Yelp Rating)
Y-axis label: Frequency (or Number of Ratings)
The x-axis represents the number of stars (1 to 5), and the y-axis shows how many times each rating was given.
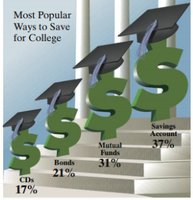
Q14. The following is a USA Today-type graph. Do you think the graph is misleading? Why? If you think it is misleading, what might be done to improve the graph?
Background
Topic: Data Visualization – Misleading Graphs
This question tests your ability to critically evaluate graphs for misleading elements and suggest improvements, which is important for interpreting and presenting statistical data accurately.
Key Terms:
Misleading Graph: A graph that distorts the data, either intentionally or unintentionally, leading to incorrect interpretations.
Proportional Representation: Visual elements should accurately reflect the quantities they represent.
Axis Labeling: Axes should be clearly labeled and scaled appropriately.
Step-by-Step Guidance
Examine the visual elements of the graph. Notice the use of 3D dollar signs and their varying sizes.
Consider whether the size of each symbol accurately reflects the percentage it represents. Are the differences in size proportional to the differences in percentages?
Check if the percentages add up to more than 100%. If so, think about what this might mean (e.g., multiple responses allowed, or an error).
Evaluate whether the graph includes clear axis labels and a scale, or if it relies solely on the size of symbols to convey information.
Think about how the graph could be improved to more accurately and clearly represent the data (e.g., using a bar chart, starting axes at zero, removing 3D effects).
Try solving on your own before revealing the answer!
Final Answer:
Yes, the graph is misleading. The visual sizes of the dollar signs do not accurately represent the percentages, making the differences appear larger than they are. The percentages also add up to more than 100%, which could confuse viewers. To improve the graph, use a simple bar chart with proportional bar lengths, start the axis at zero, remove 3D effects, and clearly label the axis as % of respondents.
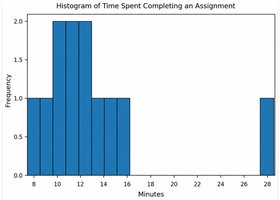
Q20. The following sample contains the number of minutes 12 students spent completing an assignment: 8, 9, 10, 10, 11, 11, 12, 12, 13, 14, 15, 28. a) Describe the shape of the distribution. b) Calculate the mean, median and mode. c) Which measure of central tendency best describes the center of the distribution? Explain your answer.
Background
Topic: Descriptive Statistics – Measures of Central Tendency and Distribution Shape
This question tests your ability to describe the shape of a distribution, calculate mean, median, and mode, and determine which measure best represents the data's center, especially in the presence of outliers.
Key Terms and Formulas:
Mean (Average):
Median: The middle value when data is ordered; if even number of values, average the two middle values.
Mode: The value(s) that appear most frequently in the data set.
Skewed Distribution: A distribution with a long tail on one side (right/positive or left/negative).
Resistant Statistic: A measure that is not greatly affected by outliers (e.g., median).
Step-by-Step Guidance
Order the data from smallest to largest (already ordered in this case): 8, 9, 10, 10, 11, 11, 12, 12, 13, 14, 15, 28.
Describe the shape: Look for symmetry or skewness. Notice if there is a long tail on one side (e.g., the value 28 is much higher than the rest).
Calculate the mean: Add all values and divide by the number of data points ().
Find the median: For 12 values, the median is the average of the 6th and 7th values in the ordered list.
Determine the mode: Identify which value(s) appear most frequently.
Consider which measure (mean, median, or mode) best describes the center, especially given the presence of an outlier (28).
Try solving on your own before revealing the answer!
Final Answer:
a) The distribution is skewed right (positively skewed) due to the outlier at 28 minutes.
b) Mean: ; Median: (11 + 12)/2 = 11.5; Mode: 10, 11, and 12 (multimodal).
c) The median best describes the center because the outlier (28) pulls the mean upward, while the median is resistant to extreme values.
