 Back
Introductory Statistics STA 2023 – Course Structure, Topics, and Study Guide
Study Guide - Smart Notes
 Tailored notes based on your materials, expanded with key definitions, examples, and context.
Course Overview
Introduction to STA 2023: Introductory Statistics
This course provides a comprehensive introduction to statistics, focusing on both descriptive and inferential methods. Students will learn to visualize, summarize, and interpret data, apply probability concepts, analyze random variables, and use statistical inference to make decisions based on sample data. The course is suitable for students across various disciplines and emphasizes practical applications using technology, such as the TI-84 calculator and statistical software.

Required Materials
Textbook and Technology
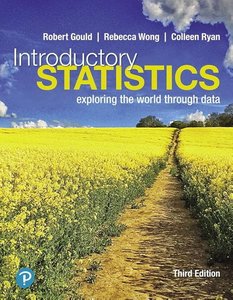
Textbook: Essential Statistics (Pearson Education, 3rd Edition) by Robert Gould, Rebecca Kimmae Wong, Colleen Nooter Ryan
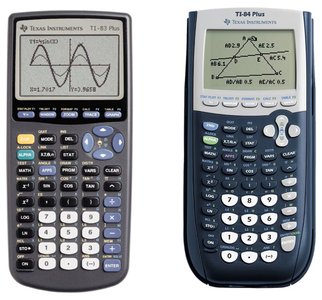
Calculator: TI-83 or TI-84 graphing calculator with statistical features
Computer: Internet access, compatible browser (Google Chrome), webcam, and necessary software/plugins for Canvas and Pearson MyStatLab
Course Outcomes
Learning Objectives
Visualize and summarize data using descriptive statistics
Apply basic probability concepts to draw reasonable conclusions
Employ concepts of random variables, sampling distributions, and the Central Limit Theorem
Choose appropriate inferential methods, including confidence intervals and hypothesis testing
Model linear relationships using correlation and regression
Assessment Structure
Grading Breakdown
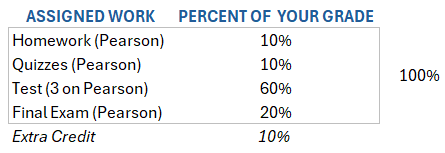
The course grade is determined by a combination of homework, quizzes, tests, and a final exam. Extra credit opportunities may be available.
ASSIGNED WORK | PERCENT OF YOUR GRADE |
|---|---|
Homework (Pearson) | 10% |
Quizzes (Pearson) | 10% |
Test (3 on Pearson) | 60% |
Final Exam (Pearson) | 20% |
Extra Credit | 10% |
Grade Scale
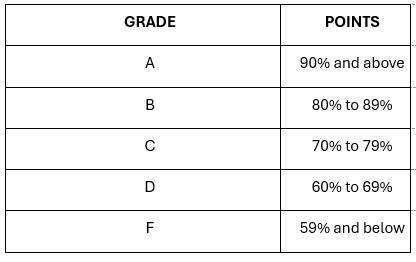
GRADE | POINTS |
|---|---|
A | 90% and above |
B | 80% to 89% |
C | 70% to 79% |
D | 60% to 69% |
F | 59% and below |
Course Outline and Topics
Weekly Topics and Chapter Coverage
Week 1: Introduction, terminology, classifying data, types of studies (observational vs. controlled experiment)
Week 2: Graphing data – Bar charts, Pareto diagrams, pie charts, histograms, dot plots, stem-and-leaf plots
Week 3: Numerical summaries – Center, spread, shape; mean, median, mode, range, standard deviation, interquartile range, boxplots, z-scores, Empirical Rule
Week 4: Test 1 (Chapters 1–3)
Week 5: Correlation and simple linear regression – Scatterplots, correlation coefficient, regression line, slope, y-intercept, predictions, extrapolation, coefficient of determination
Week 6: Probability – Union, intersection, conditional probability, independent/dependent events
Week 7: Discrete and continuous random variables – Normal distribution, probability, inverse Normal problems
Week 8: Test 2 (Chapters 4–6)
Week 9–10: Sampling distributions, expected value, standard error, Central Limit Theorem, probabilities involving sample proportion
Week 10–11: Confidence intervals for population proportion, inference, margin of error
Week 11: Hypothesis tests for one and two population proportions, test statistics, p-values, conclusions
Week 12–13: Sampling distribution for sample mean, confidence intervals, hypothesis tests for population mean
Week 14: Test 3 (Chapters 7–9)
Final Exam Week: Cumulative final exam (Chapters 1–9)
Key Statistical Concepts
Descriptive Statistics
Descriptive statistics involve methods for summarizing and visualizing data. Common measures include:
Mean: The average value of a data set.
Median: The middle value when data are ordered
Mode: The most frequently occurring value
Range: Difference between maximum and minimum values
Standard Deviation: Measures spread around the mean.
Interquartile Range (IQR): Difference between the 75th and 25th percentiles
Boxplot: Visual representation of the five-number summary (minimum, Q1, median, Q3, maximum)
Probability and Random Variables
Probability quantifies the likelihood of events. Random variables can be discrete (countable outcomes) or continuous (measurable outcomes).
Probability of an event:
Conditional Probability:
Normal Distribution: Bell-shaped curve described by mean and standard deviation
Empirical Rule: For normal distributions, about 68% of values fall within , 95% within , and 99.7% within
Sampling Distributions and Central Limit Theorem
Sampling distributions describe the distribution of a statistic (e.g., mean, proportion) from repeated samples. The Central Limit Theorem states that the sampling distribution of the sample mean approaches a normal distribution as sample size increases, regardless of the population's distribution.
Standard Error:
Central Limit Theorem: For large , is approximately normal with mean and standard error
Confidence Intervals
Confidence intervals estimate population parameters with a specified level of confidence (e.g., 95%).
Confidence Interval for Mean:
Margin of Error:
Hypothesis Testing
Hypothesis testing evaluates claims about population parameters using sample data. Key steps include:
State null () and alternative () hypotheses
Choose significance level ()
Calculate test statistic
Find p-value and draw conclusion
Correlation and Regression
Correlation measures the strength and direction of linear relationships between variables. Regression models predict values using the least squares method.
Correlation Coefficient: ranges from -1 to 1
Regression Line:
Coefficient of Determination: measures proportion of variance explained
Student Success Tips
Participate actively and apply concepts to real-world situations
Practice interpreting numerical and graphical results
Review textbook, lesson videos, and take detailed notes
Work through homework problems by hand
Seek help from instructor, Learning Commons, or library as needed
Additional info:
All images included are directly relevant to course structure, materials, and grading.
Formulas and equations are provided in LaTeX format for clarity and exam preparation.
Tables are recreated in HTML for accessibility and study reference.
