 Back
Introductory Statistics Study Guide: Distribution, Shape, and Comparison
Study Guide - Smart Notes
 Tailored notes based on your materials, expanded with key definitions, examples, and context.
Q1. Graph the distribution of height of organisms as a stem and leaf.
Background
Topic: Data Visualization (Stem-and-Leaf Plot)
This question tests your ability to organize and display quantitative data using a stem-and-leaf plot, which is a common method in introductory statistics for visualizing the distribution of a dataset.
Key Terms:
Stem-and-Leaf Plot: A graphical method for displaying data where each data value is split into a "stem" (typically the leading digit(s)) and a "leaf" (typically the last digit).
Distribution: The way in which data values are spread or clustered.
Step-by-Step Guidance
Organize the data values by sorting them from smallest to largest.
Identify the stems (e.g., tens place) and leaves (e.g., units place) for each value.
Construct the stem-and-leaf plot by listing stems in a column and attaching the leaves to each stem.
Check that all data values are included and the plot is accurate.
Try solving on your own before revealing the answer!
Final Answer:
The stem-and-leaf plot for the given heights is:
12 | 0 0 0 2 4 6 8 13 | 0 0 2 4 6 8 14 | 0 2 4 6 8
This plot shows the distribution of heights, with stems representing the tens and leaves representing the units.
Q2. Comment on the shape of the distribution of the graph (symmetric, skewed left, skewed right).
Background
Topic: Distribution Shape
This question tests your understanding of how to describe the shape of a distribution based on a graphical display, such as a stem-and-leaf plot or histogram.
Key Terms:
Symmetric: The distribution is balanced on both sides.
Skewed Left: The tail is longer on the left side.
Skewed Right: The tail is longer on the right side.
Step-by-Step Guidance
Examine the stem-and-leaf plot or histogram for the distribution of heights.
Identify where most of the data values are concentrated (center, left, or right).
Look for tails or gaps in the distribution to determine if it is skewed.
Decide whether the distribution is symmetric, skewed left, or skewed right based on your observations.
Try solving on your own before revealing the answer!
Final Answer:
The distribution appears to be symmetric, as the data values are fairly evenly spread around the center with no significant tail on either side.
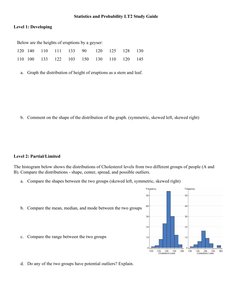
Q3. Compare the shapes, medians, and modes between two groups (cholesterol levels).
Background
Topic: Comparing Distributions
This question tests your ability to compare two distributions using graphical displays (such as histograms) and summary statistics (median and mode).
Key Terms and Formulas:
Histogram: A bar graph showing the frequency of data values in intervals.
Median: The middle value when data is ordered.
Mode: The value(s) that appear most frequently.
Step-by-Step Guidance
Examine the histograms for both groups to compare their shapes (e.g., symmetric, skewed).
Identify the median for each group by finding the middle value or estimating from the histogram.
Determine the mode for each group by identifying the interval with the highest frequency.
Compare these characteristics between the two groups.
Try solving on your own before revealing the answer!
Final Answer:
Group A has a symmetric distribution with a higher median and mode, while Group B is skewed right with a lower median and mode. The histograms visually show these differences.
Q4. Compare the range between the two groups.
Background
Topic: Range (Measure of Spread)
This question tests your ability to calculate and compare the range (difference between maximum and minimum values) for two groups.
Key Terms and Formula:
Range:
Step-by-Step Guidance
Identify the maximum and minimum values for each group from the histogram or data.
Calculate the range for each group using the formula above.
Compare the ranges to see which group has a wider spread.
Try solving on your own before revealing the answer!
Final Answer:
Group A has a larger range than Group B, indicating more variability in cholesterol levels.
Q5. Do any of the two groups have potential outliers? Explain.
Background
Topic: Outliers
This question tests your ability to identify potential outliers in a dataset using graphical displays and statistical reasoning.
Key Terms:
Outlier: A data value that is much higher or lower than the rest of the values.
Step-by-Step Guidance
Examine the histograms for unusually high or low values that are separated from the main cluster.
Consider statistical rules for outliers, such as values more than 1.5 times the interquartile range above the third quartile or below the first quartile.
Determine if either group shows evidence of outliers based on the visual and statistical criteria.
Try solving on your own before revealing the answer!
Final Answer:
Group B appears to have potential outliers on the right side of the histogram, as there are values separated from the main cluster.
