 Back
Introductory Statistics Study Guide: Frequency Tables, Normal Distribution, Descriptive Statistics, Probability, and More
Study Guide - Smart Notes
 Tailored notes based on your materials, expanded with key definitions, examples, and context.
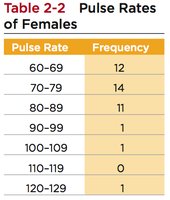
Q1. Estimate the mean pulse rate using the frequency table.
Background
Topic: Descriptive Statistics – Mean from a Frequency Table
This question tests your ability to estimate the mean (average) value from grouped data using a frequency table.
Key Terms and Formulas:
Mean (): The average value of a dataset.
Frequency Table: A table showing how often each group (class interval) occurs.
Class Midpoint: The value halfway between the lower and upper boundaries of each class.
Formula for mean from a frequency table:
Where is the frequency and is the class midpoint.
Step-by-Step Guidance
Find the midpoint for each pulse rate class interval. For example, the midpoint of 60–69 is .
Multiply each midpoint by its corresponding frequency to get for each class.
Add up all the values to get .
Add up all the frequencies to get .
Set up the formula , but do not calculate the final value yet.
Try solving on your own before revealing the answer!
Final Answer: Estimated mean pulse rate is 77.5
Midpoints: 64.5, 74.5, 84.5, 94.5, 104.5, 114.5, 124.5
Calculation:
Result:
This is the estimated mean pulse rate based on the frequency table.
Q2. In which class will the median be found?
Background
Topic: Descriptive Statistics – Median from a Frequency Table
This question tests your ability to locate the median class in grouped data using cumulative frequencies.
Key Terms and Formulas:
Median: The middle value when data is ordered.
Cumulative Frequency: The running total of frequencies up to each class.
Median Class: The class interval containing the median value.
Step-by-Step Guidance
Calculate the total number of data points (sum of frequencies).
Find the position of the median: , where is the total frequency.
Compute cumulative frequencies for each class interval.
Identify the class interval where the cumulative frequency first equals or exceeds the median position.
Try solving on your own before revealing the answer!
Final Answer: The median will be found in the 70–79 class.
The cumulative frequency reaches the median position in the 70–79 interval.
Q3. On a hard trivia game, the maximum score possible is 30 points. The average score is 18 points and the standard deviation is 3 points. The distribution of trivia scores is almost normally distributed.
Background
Topic: Normal Distribution & Empirical Rule
This question tests your understanding of the normal distribution and the empirical rule (68-95-99.7 rule) for estimating probabilities and identifying unusual values.
Key Terms and Formulas:
Normal Distribution: A symmetric, bell-shaped distribution.
Empirical Rule: In a normal distribution, about 68% of values fall within 1 standard deviation, 95% within 2, and 99.7% within 3.
Standard Deviation (): Measures spread of data.
Mean (): Average value.
Z-score:
Step-by-Step Guidance
For each range, determine how many standard deviations away from the mean the endpoints are.
Use the empirical rule to estimate the percentage of scores within each range.
For identifying "unusual" values, recall that values more than 2 standard deviations from the mean are considered unusual.
Set up the calculations for each part, but do not compute the final percentages or values yet.
Try solving on your own before revealing the answer!
Final Answers:
a) Approximately 68% of people score between 15 and 21 points (within 1 standard deviation).
b) Approximately 95% score between 9 and 27 points (within 3 standard deviations).
c) Approximately 81.5% score between 9 and 21 points (within 2 standard deviations).
d) Scores of 12 or below are considered unusually low (more than 2 standard deviations below the mean).
These answers use the empirical rule for normal distributions.
Q4. Given these 5 population data points: 35, 35, 20, 50, 30
Background
Topic: Descriptive Statistics – Measures of Central Tendency and Spread
This question tests your ability to calculate mean, median, mode, midrange, range, variance, and standard deviation for a small dataset.
Key Terms and Formulas:
Mean ():
Median: Middle value when data is ordered.
Mode: Most frequent value.
Midrange:
Range:
Variance ():
Standard Deviation ():
Step-by-Step Guidance
Order the data: 20, 30, 35, 35, 50.
Calculate the mean by summing all values and dividing by 5.
Find the median (middle value), mode (most frequent), and midrange (average of min and max).
Calculate the range: max minus min.
Set up the variance and standard deviation calculations using the table provided, but do not compute the final values yet.
Try solving on your own before revealing the answer!
Final Answers:
a) Mean: 34, Median: 35, Mode: 35, Midrange: 35
b) Range: 30, Variance: 120, Standard deviation: 10.95
c) Using Excel: Variance = 120, Standard deviation = 10.95
All calculations are based on the formulas above.
Q5. For a class project, 30% of the assignment grade depends on the first essay, 25% on the in-class presentation, and 45% on the final essay. Lewis got a score of 88 on the first essay and a 100 on the presentation. What score must they get on the final essay to have a weighted average of 90.0 for the project? Round up to the nearest whole number.
Background
Topic: Weighted Average
This question tests your ability to calculate a weighted average and solve for a missing value.
Key Terms and Formulas:
Weighted Average:
Weights (): The percentage each component contributes to the total.
Step-by-Step Guidance
Write the weighted average equation:
Calculate the contributions from the first two scores.
Set up the equation to solve for (final essay score).
Do not solve for yet; leave the equation ready for the final calculation.
Try solving on your own before revealing the answer!
Final Answer: Lewis must score at least 85 on the final essay.
Solving gives .
Rounded up to the nearest whole number, Lewis needs 85.
