 Back
Introductory Statistics Study Guide: Probability, Correlation, and Regression
Study Guide - Smart Notes
 Tailored notes based on your materials, expanded with key definitions, examples, and context.
Q1. Is there a direct cause-and-effect relationship between the variables?
Background
Topic: Correlation vs. Causation
This question tests your understanding of the difference between correlation (when two variables are related) and causation (when one variable directly affects the other).
Key Terms:
Correlation: A statistical relationship between two variables.
Causation: When a change in one variable directly causes a change in another.
Step-by-Step Guidance
Consider whether changes in one variable consistently lead to changes in the other variable.
Think about whether there is a logical or scientific reason for one variable to influence the other.
Review any evidence or examples provided that support a direct cause-and-effect relationship.
Ask yourself if other explanations (like a third variable) could account for the observed relationship.
Try solving on your own before revealing the answer!
Final Answer:
A direct cause-and-effect relationship exists if changes in one variable directly result in changes in the other, and there is evidence or logical reasoning to support this. For example, increased carbon dioxide emissions causing higher global temperatures is a cause-and-effect relationship.
Q2. Is there a reverse cause-and-effect relationship between the variables?
Background
Topic: Direction of Causality
This question asks you to consider whether the direction of causality could be the opposite of what is initially assumed.
Key Terms:
Reverse causality: When the presumed effect is actually the cause.
Step-by-Step Guidance
Identify the two variables and the assumed direction of influence.
Consider whether it is possible for the second variable to actually cause changes in the first variable.
Think of real-world examples where reverse causality might occur (e.g., does attending more classes cause better grades, or do students with better grades attend more classes?).
Evaluate the evidence for both directions of causality.
Try solving on your own before revealing the answer!
Final Answer:
Yes, sometimes the direction of causality can be reversed. For example, instead of X causing Y, it could be that Y causes X. Always consider both possibilities when analyzing relationships between variables.
Q3. Is it possible that the relationship between the variables can be caused by a third variable or perhaps a combination of several other variables?
Background
Topic: Confounding Variables and Lurking Variables
This question tests your understanding of how other variables (not directly studied) can influence the observed relationship between two variables.
Key Terms:
Confounding variable: A variable that influences both the independent and dependent variables, causing a spurious association.
Lurking variable: A hidden variable that affects the relationship between the variables being studied.
Step-by-Step Guidance
Think about other factors that could influence both variables in the relationship.
Consider examples where a third variable might be responsible for the observed association (e.g., ice cream sales and drowning rates both increase in summer due to temperature).
Ask yourself if the relationship would still exist if you controlled for the third variable.
Review the context to identify any possible lurking or confounding variables.
Try solving on your own before revealing the answer!
Final Answer:
Yes, a third variable (confounding or lurking variable) can create a relationship between two variables even if there is no direct connection between them. Always consider other possible influences when interpreting statistical relationships.
Q4. Is it possible that the relationship between two variables may be due to coincidence?
Background
Topic: Spurious Correlation
This question addresses the possibility that an observed relationship is simply due to chance and not a meaningful connection.
Key Terms:
Spurious correlation: A relationship that appears to exist between two variables but is actually due to random chance.
Step-by-Step Guidance
Consider the context and whether there is a logical reason for the variables to be related.
Think about the sample size—smaller samples are more likely to show coincidental relationships.
Review whether the relationship persists in larger or repeated studies.
Ask yourself if the relationship could be explained by randomness or coincidence.
Try solving on your own before revealing the answer!
Final Answer:
Yes, sometimes relationships between variables are due to coincidence, especially in small samples or when there is no logical connection. Always be cautious about inferring meaning from statistical associations without further evidence.
Q5. In a jury selection pool, 65% of the people are female. Of these 65%, one out of four works in a health field. Find the probability that a randomly selected person from the jury pool is female and works in a health field. Is this event unusual?
Background
Topic: Conditional Probability and Unusual Events
This question tests your ability to calculate the probability of two events both occurring (intersection), and to determine if the event is considered unusual.
Key Terms and Formulas:
Conditional Probability:
Unusual Event: An event with a probability less than 0.05 is often considered unusual.
Step-by-Step Guidance
Identify the probability that a person is female: .
Identify the probability that a person works in a health field given they are female: .
Use the multiplication rule for dependent events: .
Multiply the probabilities to find the joint probability, but do not calculate the final value yet.
Compare the result to 0.05 to determine if the event is unusual.
Try solving on your own before revealing the answer!
Final Answer:
Since 0.1625 is greater than 0.05, this event is not unusual.
Q6. Find the probability that a randomly selected person from the jury pool is female and does not work in a health field. Is this event unusual?
Background
Topic: Complementary Probability and Unusual Events
This question tests your ability to use complements to find probabilities and to assess whether an event is unusual.
Key Terms and Formulas:
Complement Rule:
Unusual Event: Probability less than 0.05 is considered unusual.
Step-by-Step Guidance
Probability that a person is female: .
Probability that a female does not work in a health field: .
Use the multiplication rule: .
Multiply the probabilities to find the joint probability, but do not calculate the final value yet.
Compare the result to 0.05 to determine if the event is unusual.
Try solving on your own before revealing the answer!
Final Answer:
Since 0.4875 is much greater than 0.05, this event is not unusual.
Q7. Summary Table: Probability Rules
Background
Topic: Probability Rules and Types
This table summarizes the main types of probability (classical, empirical), the range of probability values, complementary events, and the multiplication and addition rules for finding probabilities of combined events.
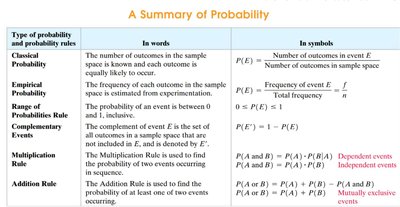
Key Terms and Formulas:
Classical Probability:
Empirical Probability:
Range of Probability:
Complementary Events:
Multiplication Rule: (dependent), (independent)
Addition Rule:
Step-by-Step Guidance
Review the definitions and formulas for each type of probability and rule.
Practice applying these rules to different probability problems (e.g., using the addition rule for mutually exclusive events).
Use the table as a reference when solving probability questions.
Try solving on your own before revealing the answer!
Final Answer:
The table provides a concise summary of probability types and rules, including classical and empirical probability, the range of probability values, complementary events, and the multiplication and addition rules. Use these as a reference for solving probability problems.
