 Back
Introductory Statistics Study Guide: Probability, Distributions, and Sampling
Study Guide - Smart Notes
 Tailored notes based on your materials, expanded with key definitions, examples, and context.
Contingency Tables and Association
Contingency Tables: Two-way Tables
Contingency tables are used to summarize the relationship between two categorical variables. Each cell in the table shows the frequency of occurrences for a combination of categories.
Row variable: Represents one category grouping.
Column variable: Represents another category grouping.
Marginal distribution: Distribution of totals for each variable.
Conditional distribution: Distribution of one variable given a specific value of the other variable.
Conditional Distribution
The conditional distribution is the relative frequency of each category of the response variable, given a specific value of the explanatory variable.
Formula:
Example: Calculating the proportion of students who prefer a certain subject given their grade level.
Probability
Probability Rules
Probability quantifies the likelihood of events occurring. The probability of an event is a number between 0 and 1, where 0 means impossible and 1 means certain.
Sample space: The set of all possible outcomes.
Event: A subset of the sample space.
Probability model: Assigns probabilities to events in the sample space.
Basic Probability Rules
Rule of Complements:
Addition Rule:
Multiplication Rule (for independent events):
Venn Diagrams
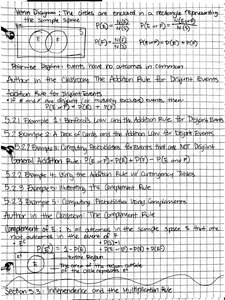
Venn diagrams visually represent relationships between events in a sample space. They help illustrate union, intersection, and complement of events.
Union:
Intersection:
Mutually exclusive events: Events that cannot occur together.
Independent and Dependent Events
Events are independent if the occurrence of one does not affect the probability of the other. Otherwise, they are dependent.
Independent:
Dependent:
Discrete Probability Distributions
Random Variables
A random variable is a numerical outcome of a probability experiment. Discrete random variables take on a countable number of values.
Probability distribution: Assigns probabilities to each possible value.
Mean (expected value):
Variance:
Binomial Distribution
The binomial distribution models the number of successes in a fixed number of independent trials, each with the same probability of success.
Criteria: Fixed number of trials, two outcomes (success/failure), independent trials, constant probability.
Probability formula:
Mean:
Standard deviation:
The Normal Probability Distribution
Properties of the Normal Distribution
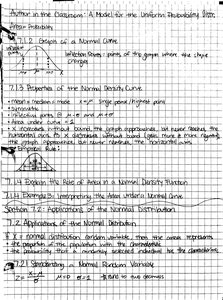
The normal distribution is a continuous, symmetric, bell-shaped curve characterized by its mean and standard deviation.
Mean: Center of the distribution.
Standard deviation: Controls the spread.
Empirical rule: 68% of data within 1 SD, 95% within 2 SD, 99.7% within 3 SD.
Standard Normal Distribution
The standard normal distribution has a mean of 0 and a standard deviation of 1. Z-scores measure the number of standard deviations a value is from the mean.
Z-score formula:
Applications: Finding probabilities and percentiles using standard normal tables.
Sampling Distributions
Sampling Distribution of the Sample Mean
The sampling distribution of the sample mean describes the distribution of sample means from repeated samples of the same size from a population.
Central Limit Theorem: For large samples, the sampling distribution of the mean is approximately normal, regardless of the population distribution.
Mean:
Standard error:
Applications
Sampling distributions are used to make inferences about population parameters based on sample statistics.
Example: Estimating the population mean using the sample mean.
