 Back
Introductory Statistics Test 1 Review – Step-by-Step Study Guidance
Study Guide - Smart Notes
 Tailored notes based on your materials, expanded with key definitions, examples, and context.
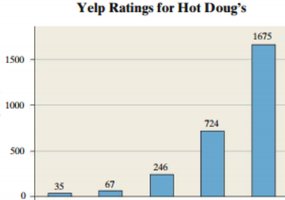
Q13. The following graph shows the ratings (1-5 stars) on Yelp for Hot Doug’s Restaurant. Label the x and y axis.
Background
Topic: Frequency Distributions & Data Visualization
This question tests your ability to interpret and label axes on a bar graph (histogram) that displays frequency data. Understanding how to label axes is fundamental for correctly reading and presenting statistical graphs.
Key Terms:
Frequency: The number of times a particular value or category occurs.
Histogram/Bar Graph: A graphical representation of data where the height of each bar shows the frequency of each category.
Axis Labels: The x-axis typically shows the categories or values, and the y-axis shows the frequency/count.
Step-by-Step Guidance
Examine the graph and identify what each bar represents. In this case, each bar corresponds to a Yelp rating (1 to 5 stars).
Determine what is shown along the horizontal axis (x-axis). Typically, this axis displays the categories being measured—in this case, the star ratings.
Determine what is shown along the vertical axis (y-axis). This axis usually displays the frequency or count of each category—in this case, the number of reviews for each rating.
Think about how you would label each axis to clearly communicate what the data represents.
Try solving on your own before revealing the answer!
Final Answer:
X-axis label: "Yelp Star Rating" (or "Number of Stars")
Y-axis label: "Number of Reviews" (or "Frequency")
The x-axis shows the possible star ratings (1, 2, 3, 4, 5), and the y-axis shows how many reviews gave each rating.
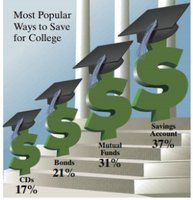
Q14. The following is a USA Today-type graph. Do you think the graph is misleading? Why? If you think it is misleading, what might be done to improve the graph?
Background
Topic: Data Visualization & Graphical Misrepresentation
This question tests your ability to critically evaluate a graph for potential misleading features and suggest improvements. Recognizing misleading graphs is important for interpreting statistics accurately.
Key Terms:
Misleading Graph: A graph that visually exaggerates or distorts the data, often through inappropriate scaling, sizing, or design choices.
Proportional Representation: Ensuring that visual elements (such as bars or icons) accurately reflect the underlying data values.
Axis Scaling: The way the axes are scaled can affect how data is perceived.
Step-by-Step Guidance
Examine the graph and note how the visual elements (dollar signs) are used to represent the different saving methods and their percentages.
Compare the sizes of the dollar signs to the actual percentages. Are the visual sizes proportional to the data values?
Consider whether the graph could mislead viewers by exaggerating differences between categories.
Think about how the graph could be improved to more accurately represent the data (e.g., using bars of proportional height, consistent scaling, or clearer axis labels).
Try solving on your own before revealing the answer!
Final Answer:
Yes, the graph is likely misleading because the dollar signs are not scaled proportionally to the percentages. The largest dollar sign visually exaggerates the difference between categories, making the savings account appear much more popular than it actually is.
To improve the graph, use a bar chart with bars scaled proportionally to the percentages, and add clear axis labels. Avoid using icons whose area or volume exaggerates differences.
