 Back
Linear Regression and Correlation: Understanding and Applying the Least Squares Method
Study Guide - Smart Notes
 Tailored notes based on your materials, expanded with key definitions, examples, and context.
Linear Regression
Introduction to Linear Regression
Linear regression is a statistical method used to model the relationship between two quantitative variables by fitting a straight line (the regression line) to the observed data. This line is used to predict the value of one variable (the response variable) based on the value of another (the explanatory or predictor variable).
Scatterplots and Data Visualization
Scatterplots are graphical representations that show the relationship between two quantitative variables. Each point represents an observation.
Direction: Indicates whether the relationship is positive, negative, or has no association.
Form: Describes whether the relationship is linear or nonlinear.
Strength: Refers to how closely the data points follow a clear form.
Unusual Features: Outliers or clusters that do not fit the general pattern.
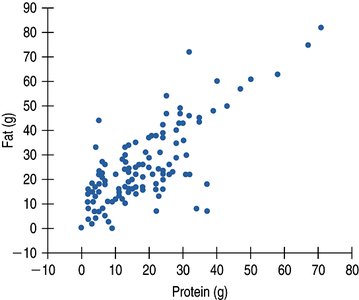
Correlation and Its Conditions
Correlation measures the strength and direction of the linear relationship between two quantitative variables. The correlation coefficient, r, ranges from -1 to +1.
Quantitative Variables Condition: Both variables must be quantitative.
Straight Enough Condition: The relationship should be approximately linear.
No Outliers Condition: Outliers can distort the correlation.
The Linear Model
Equation of the Regression Line
The regression line is typically written as:
\( b_0 \): Intercept (value of \( \hat{y} \) when \( x = 0 \))
\( b_1 \): Slope (change in \( \hat{y} \) for a one-unit increase in \( x \))
For example, in the Burger King menu data:
Interpreting the Coefficients
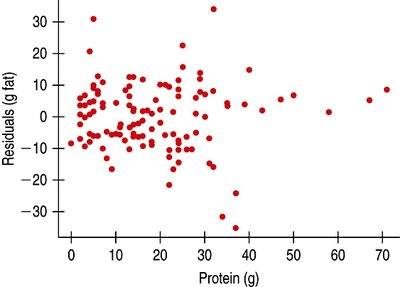
Slope (\( b_1 \)): For every additional gram of protein, the fat content increases by 0.91 grams on average.
Intercept (\( b_0 \)): When protein is 0 grams, the estimated fat content is 8.4 grams. Sometimes, the intercept may not have a meaningful interpretation if \( x = 0 \) is not realistic in context.
Residuals
The residual for each observation is the difference between the observed value and the value predicted by the regression line:
Residuals help assess how well the model fits the data. If the model fits well, residuals should be close to zero.
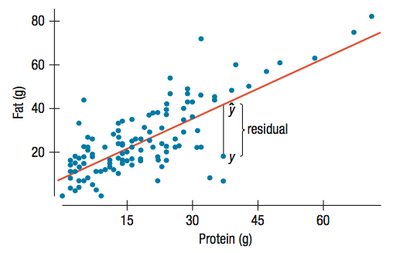
Example: Calculating a Residual
For the BK Tendercrisp chicken sandwich (no mayo):
Observed protein: 31g
Predicted fat: g
Observed fat: 22g
Residual: g
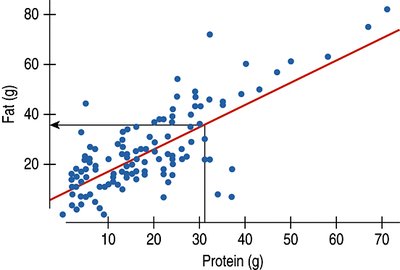
Finding the Least Squares Line
Least Squares Criterion
The best-fitting line minimizes the sum of the squared residuals. This is known as the least squares criterion.
Formulas for Slope and Intercept
Slope:
Intercept:
The sign of the slope matches the sign of the correlation coefficient.
Conditions for Regression
Quantitative Variables Condition
Straight Enough Condition
No Outliers Condition
Does the Plot Thicken? Condition (homoscedasticity: equal spread of residuals)
Roles for Variables
In regression, the explanatory (predictor) variable is plotted on the x-axis, and the response variable is plotted on the y-axis. The choice of which variable is x and which is y is critical in regression (unlike correlation).

Regression Example: Interest Rates vs. Mortgages
Data Table
The following table shows mortgage amounts and interest rates over several years:
Mortgages (in billions of dollars) | Interest Rate |
|---|---|
122.7 | 12.5 |
116.4 | 14.4 |
112.4 | 14.7 |
117.5 | 12.3 |
121.2 | 12.0 |
127.4 | 11.2 |
141.3 | 9.8 |
153.2 | 8.9 |
160.8 | 9.0 |
164.6 | 9.8 |
155.4 | 9.7 |
152.4 | 9.1 |
151.3 | 7.8 |
144.6 | 6.9 |
144.8 | 7.3 |
141.5 | 7.7 |
147.8 | 7.6 |
154.1 | 7.5 |
157.9 | 7.0 |
163.3 | 7.1 |
168.2 | 7.9 |
171.7 | 6.9 |
177.4 | 6.4 |
178.2 | 5.7 |
191.8 | 5.7 |
210.8 | 5.9 |
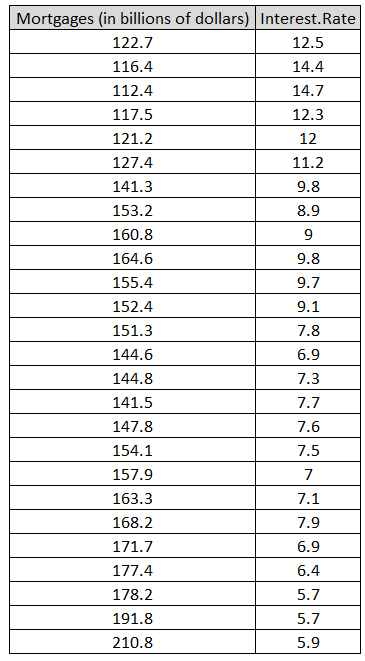
Regression Equation
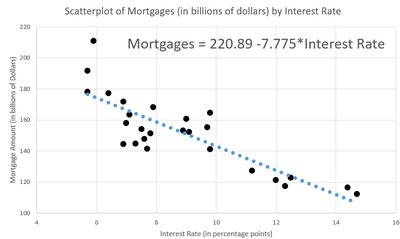
The least squares regression line for this data is:
Slope interpretation: For each percentage point increase in interest rate, the mortgage amount decreases by about $7.78 billion.
Intercept interpretation: The intercept (220.89) is the predicted mortgage amount when the interest rate is 0%, which may not be meaningful in context.
Calculating Predicted Values and Residuals
For observation #21: x = 7.9, y = 168.2
Predicted value:
Residual:
Examining the Residuals
Residual Plots
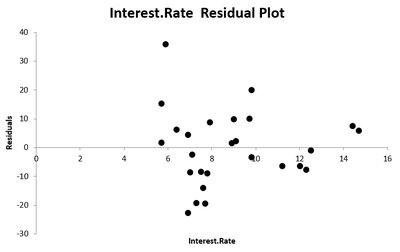
Residual plots help check regression assumptions. Ideally, residuals should be randomly scattered with no pattern.
Regression Assumptions and Conditions
Quantitative Variables Condition
Straight Enough Condition
No Outliers Condition
Does the Plot Thicken? Condition (homoscedasticity)
R2: The Variation Accounted for by the Model
Definition and Interpretation
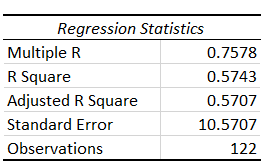
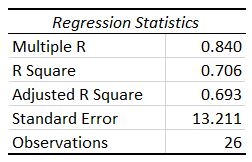
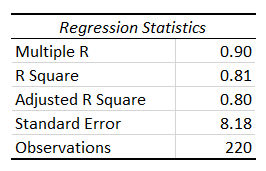
R2 (the coefficient of determination) is the proportion of the variance in the response variable explained by the regression model. It is calculated as the square of the correlation coefficient:
R2 = 0: The model explains none of the variance.
R2 = 1: The model explains all the variance.
For the Burger King example: R2 = 0.5743, meaning 57.43% of the variation in fat content is explained by protein content.
Making Predictions and Extrapolation
Precautions
Predictions should only be made within the range of the observed data. Extrapolating beyond this range can lead to unreliable and inaccurate results.
Statistical Significance in Regression
Testing the Slope
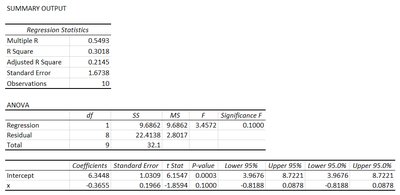
To determine if the observed linear association is statistically significant (not due to random chance), we test the null hypothesis that the slope is zero. The p-value from the regression output is compared to a significance threshold (commonly 0.05).
If p-value < 0.05: The regression is statistically significant.
If p-value > 0.05: The regression is not statistically significant; the association may be due to chance.
Example: Two Spinners
In an example with two fair spinners, the regression slope was -0.3655, but the p-value was 0.1000 (> 0.05), indicating the association is not statistically significant and likely due to chance.
Summary Table: Key Regression Concepts
Concept | Definition | Formula |
|---|---|---|
Regression Line | Best-fit line for predicting y from x | |
Slope (b1) | Change in y per unit change in x | |
Intercept (b0) | Predicted y when x = 0 | |
Residual | Difference between observed and predicted y | |
R2 | Proportion of variance explained by model |
