 Back
Linear Regression, Sampling Designs, and Probability: Study Notes for Introductory Statistics
Study Guide - Smart Notes
 Tailored notes based on your materials, expanded with key definitions, examples, and context.
Linear Regression
Introduction to Linear Regression
Linear regression is a statistical method used to model the relationship between two quantitative variables. The goal is to predict the value of one variable (the response variable) based on the value of another (the explanatory variable). - Scatterplots are used to visualize the relationship between variables. - Direction, form, strength, and unusual features are key aspects to examine in scatterplots. 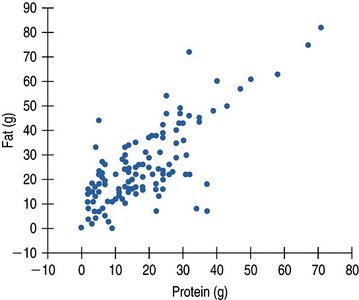
Correlation and Regression Conditions
Before using correlation or regression, certain conditions must be checked: - Quantitative Variables Condition: Both variables must be quantitative. - Straight Enough Condition: The relationship should be approximately linear. - No Outliers Condition: Outliers can distort the analysis.
The Linear Model
The linear regression model is expressed as: where is the predicted value, is the intercept, and is the slope. - Slope (): Indicates how much changes for each unit increase in . - Intercept (): The predicted value of when .
Residuals
Residuals measure the difference between observed and predicted values: - If the model fits well, residuals are close to zero. 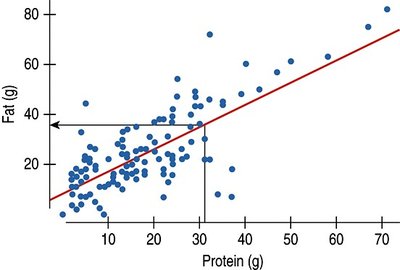
Example: Burger King Tendercrisp Chicken Sandwich
- Observed: grams protein, grams fat - Model: - Predicted fat: grams - Residual: grams 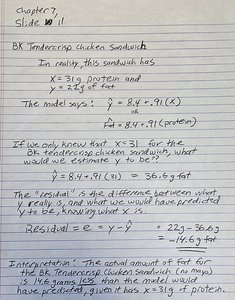
Interpreting Coefficients
- Slope: For every additional gram of protein, expect an additional 0.91 grams of fat. - Intercept: For 0 grams of protein, estimate 8.4 grams of fat.
Roles for Variables
- In regression, the explanatory variable () is plotted on the x-axis, and the response variable () on the y-axis.
Regression Output and R-Squared
- R-Squared (): Measures the proportion of variance in the response variable explained by the explanatory variable. - Example: means 57.43% of the variation in fat is explained by protein. 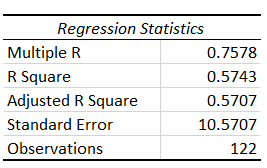
Residual Plots
- Residual plots help check regression assumptions. - Ideally, residuals should show no pattern. 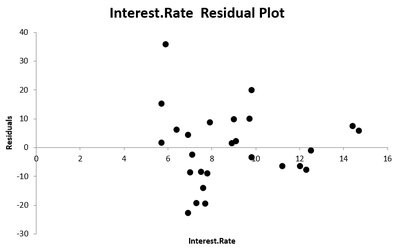
Regression Conditions Review
- Quantitative Variables Condition - Straight Enough Condition - No Outliers Condition - Does the Plot Thicken? Condition
Using Regression for Prediction
- Avoid using regression equations to predict values outside the range of the original data (extrapolation).
Outliers and Their Impact
- Outliers can strongly influence regression results. - Even a single outlier can change the slope and intercept significantly. 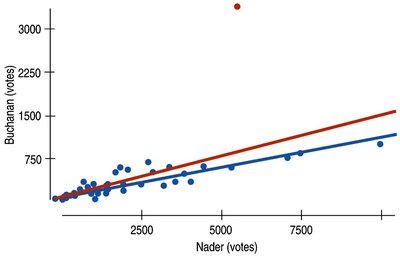
Causation Revisited
- Correlation does not imply causation. - A high does not prove that changes in cause changes in .
Sample Designs
Population and Sample
- Population: The entire group of interest. - Sample: A subset of the population used to estimate population parameters. - Population parameter: A numerical summary of the population (mean, standard deviation, etc.). - Sample statistic: A numerical summary of the sample.
Sampling Frame and Bias
- Sampling frame: The list from which the sample is drawn. - If the frame misses part of the population, it is biased.
Types of Sampling Bias
- Voluntary Response Bias: Only those with strong opinions respond.  - Convenience Sampling: Sample is chosen based on ease of access. - Undercoverage: Some groups are not represented. - Nonresponse: Those who do not respond may differ from those who do. - Response Bias: Question wording or interviewer behavior influences answers.
Sampling Designs
- Simple Random Sample: Every member has an equal chance of being selected. - Systematic Sample: Every k-th member is selected after a random start. - Stratified Random Sample: Population is divided into strata, and random samples are taken from each. - Cluster Sample: Population is divided into clusters, and entire clusters are sampled. - Multistage Sample: Combines several sampling methods.
Probability
Random Phenomena and Sample Space
- Random phenomenon: An event whose outcome cannot be predicted with certainty. - Trial: Each observation of a random phenomenon. - Outcome: The result of a trial. - Event: A combination of outcomes. - Sample space (S): The set of all possible outcomes.
The Law of Large Numbers
- The long-run relative frequency of repeated independent events approaches a single value, called the probability.
Modeling Probability
- If all outcomes are equally likely:
Formal Probability Rules
1. Probability Range: 2. Probability Assignment Rule: 3. Complement Rule: 4. Addition Rule (Disjoint Events): if A and B are disjoint. 5. Multiplication Rule (Independent Events): if A and B are independent.
Sampling Distributions
Sampling Distribution for Proportions
- Sample proportion (): - The distribution of all possible sample proportions is called the sampling distribution of .
Properties
- Expected value: - Standard deviation: where - Shape: Approximately Normal if certain conditions are met.
Assumptions and Conditions
- Independence Assumption: Data values should be independent. - Randomization Condition: Sample should be random. - 10% Condition: Sample size should be no more than 10% of population. - Success/Failure Condition: and
Sampling Distribution for Means
- Sample mean (): The average of sample values. - The Central Limit Theorem (CLT) states that the sampling distribution of the sample mean is nearly Normal for large enough sample sizes, regardless of the population's shape.
Properties
- Expected value: - Standard deviation:
Assumptions and Conditions
- Independence Assumption - Randomization Condition - 10% Condition - Large Enough Condition: is usually sufficient for most populations; may be needed for highly skewed populations.
Which Normal Model?
- For proportions: Centered at , standard deviation - For means: Centered at , standard deviation
Summary Table: Regression Statistics
Statistic | Value |
|---|---|
Multiple R | 0.7578 |
R Square | 0.5743 |
Adjusted R Square | 0.5707 |
Standard Error | 10.5707 |
Observations | 122 |
Additional info: Academic context and explanations have been expanded for clarity and completeness.
