 Back
BackMAT 118 Final Exam Review – Statistics Study Guidance
Study Guide - Smart Notes
 Tailored notes based on your materials, expanded with key definitions, examples, and context.
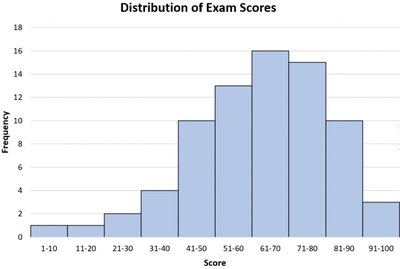
Q15. Where is the mode of the Histogram?
Background
Topic: Descriptive Statistics – Mode
This question tests your ability to interpret a histogram and identify the mode, which is the value or interval with the highest frequency.
Key Terms:
Mode: The value or interval that appears most frequently in a data set.
Histogram: A graphical representation of the distribution of numerical data, where the height of each bar shows the frequency of values in each interval.
Step-by-Step Guidance
Examine the histogram and identify which interval has the tallest bar (highest frequency).
Compare the frequencies of each interval to determine which one is the mode.
Remember, the mode is the interval with the greatest frequency, not necessarily the midpoint or average.
Try solving on your own before revealing the answer!
Final Answer: (c) 61-70
The mode is the interval 61-70 because it has the highest frequency in the histogram.
Q16. Describe the shape of the distribution.
Background
Topic: Descriptive Statistics – Distribution Shape
This question tests your ability to describe the shape of a distribution based on a histogram.
Key Terms:
Symmetric: The left and right sides of the histogram are approximately mirror images.
Skewed Left: The tail on the left side is longer or fatter than the right side.
Skewed Right: The tail on the right side is longer or fatter than the left side.
Uniform: All intervals have approximately the same frequency.
Step-by-Step Guidance
Look at the histogram and observe the shape of the bars.
Determine if the distribution is symmetric, skewed left, skewed right, or uniform.
Check if the frequencies decrease evenly on both sides of the mode or if one tail is longer.
Try solving on your own before revealing the answer!
Final Answer: (c) symmetric
The distribution is symmetric because the frequencies rise to a peak and then fall off evenly on both sides.
Q17. What is the probable relationship between the mean and median?
Background
Topic: Descriptive Statistics – Mean vs. Median
This question tests your understanding of how the shape of a distribution affects the relationship between the mean and median.
Key Terms:
Mean: The average value of the data set.
Median: The middle value when the data is ordered.
Symmetric Distribution: In a symmetric distribution, the mean and median are usually equal.
Skewed Distribution: In a skewed distribution, the mean is pulled toward the tail.
Step-by-Step Guidance
Recall that in a symmetric distribution, the mean and median are typically equal.
Consider the histogram shape from the previous question.
Think about how the mean and median relate in symmetric versus skewed distributions.
Try solving on your own before revealing the answer!
Final Answer: (a) Mean = Median
For a symmetric distribution, the mean and median are approximately equal.
Q18. Which is the preferred measure of center for this distribution?
Background
Topic: Descriptive Statistics – Measures of Center
This question tests your ability to choose the best measure of center (mean, median, or mode) based on the shape of the distribution.
Key Terms:
Mean: Sensitive to outliers and skewed data.
Median: Resistant to outliers and skewed data.
Mode: The most frequent value.
Symmetric Distribution: Mean is usually the preferred measure of center.
Step-by-Step Guidance
Recall the shape of the distribution (symmetric).
Consider which measure of center is most appropriate for symmetric distributions.
Think about the advantages and disadvantages of mean, median, and mode.
Try solving on your own before revealing the answer!
Final Answer: (a) Mean
For symmetric distributions, the mean is the preferred measure of center.
