 Back
BackMatching Scatterplots to Correlation Values
Study Guide - Smart Notes
 Tailored notes based on your materials, expanded with key definitions, examples, and context.
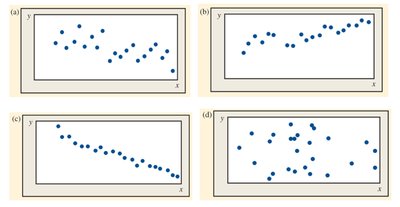
Q5. Match the scatterplots below with the correlation values: R = -0.9, R = 0, R = -0.5, and R = 0.6
Background
Topic: Correlation and Scatterplots
This question tests your ability to visually interpret scatterplots and associate them with the correct correlation coefficient. Correlation measures the strength and direction of a linear relationship between two variables.
Key Terms and Formulas
Correlation coefficient (R): A value between -1 and 1 that indicates the strength and direction of a linear relationship.
Scatterplot: A graph that shows the relationship between two variables using dots.
Positive correlation: As one variable increases, the other tends to increase (R > 0).
Negative correlation: As one variable increases, the other tends to decrease (R < 0).
No correlation: No clear relationship (R ≈ 0).
Step-by-Step Guidance
Examine each scatterplot and look for the overall trend. Is it upward, downward, or random?
Recall that a strong positive correlation (R close to 1) will show points closely grouped along an upward-sloping line. A strong negative correlation (R close to -1) will show points closely grouped along a downward-sloping line. No correlation (R ≈ 0) will show points scattered randomly.
Compare the scatterplots to these descriptions. For example, a plot with points tightly clustered along a downward slope likely corresponds to R = -0.9.
Assign the correlation values to each plot based on the strength and direction of the relationship you observe.
Try solving on your own before revealing the answer!
Final Answer:
(a) R = -0.5; (b) R = 0.6; (c) R = -0.9; (d) R = 0
Each scatterplot matches the correlation value based on the direction and strength of the linear relationship. For example, plot (c) shows a strong negative trend, so it matches R = -0.9.
