Back
BackMath 2193 - Elementary Statistics: First Exam Review Study Notes
Study Guide - Smart Notes
 Tailored notes based on your materials, expanded with key definitions, examples, and context.
Math 2193 - Elementary Statistics: First Exam Review
Introduction to Statistics
This section introduces the foundational concepts of statistics, including definitions and distinctions between populations and samples, as well as types of data and variables.
Population vs. Sample: - Population: The entire group of individuals or items under study. - Sample: A subset of the population selected for analysis. - Example: If studying college students, the population is all college students, while a sample might be students from one university.
Types of Data: - Qualitative (Categorical): Data that describes qualities or categories (e.g., gender, color). - Quantitative (Numerical): Data that represents counts or measurements (e.g., height, age).
Variables: - Discrete: Countable values (e.g., number of siblings). - Continuous: Measurable values within a range (e.g., weight).
Exploring Data with Tables and Graphs
Data can be organized and visualized using various tables and graphical methods to reveal patterns and distributions.
Frequency Distribution: A table that shows how often each value occurs.
Histograms: Bar graphs representing frequency distributions of quantitative data.
Bar Graphs and Pie Charts: Used for categorical data to show proportions.
Stem-and-Leaf Plots: Display data while retaining original values.
Dot Plots: Simple visual representation of data points.
Describing, Exploring, and Comparing Data
This section covers statistical measures used to summarize and compare data sets, including measures of central tendency and variation.
Measures of Center: - Mean: The average value. - Median: The middle value when data is ordered. - Mode: The value that appears most frequently.
Measures of Variation: - Range: Difference between the highest and lowest values. - Variance: Average squared deviation from the mean. - Standard Deviation: Square root of variance.
Percentiles and Quartiles: - Percentile: Indicates the relative standing of a value. - Quartiles: Divide data into four equal parts.
Boxplots: Visual summary of data showing median, quartiles, and extremes.
Comparing Data and Identifying Outliers
Statistical techniques help identify unusual values and compare distributions.
Outliers: Values that are significantly higher or lower than most of the data.
Comparing Distributions: Use measures of center and spread to compare different data sets.
Classifying Data and Levels of Measurement
Data can be classified according to its level of measurement, which determines the types of statistical analyses that can be performed.
Levels of Measurement: - Nominal: Categories without order (e.g., colors). - Ordinal: Categories with a meaningful order (e.g., rankings). - Interval: Ordered values with equal intervals, no true zero (e.g., temperature in Celsius). - Ratio: Ordered values with equal intervals and a true zero (e.g., height, weight).
Sampling Methods and Experimental Design
Proper sampling and study design are essential for valid statistical inference.
Sampling Methods: - Random Sampling: Every member has an equal chance of selection. - Systematic Sampling: Select every nth member. - Stratified Sampling: Divide population into strata and sample from each. - Cluster Sampling: Divide population into clusters and randomly select clusters.
Observational Study vs. Experimental Study: - Observational Study: Observe subjects without intervention. - Experimental Study: Apply treatment and observe effects.
Organizing Data: Tables and Graphs
Data organization is crucial for analysis and interpretation. Frequency tables and graphical displays are commonly used.
Frequency Table: Summarizes data by showing counts for each category or interval.
Relative Frequency: Proportion of each category relative to the total.
Cumulative Frequency: Running total of frequencies up to a certain point.
Describing Data: Measures of Center and Variation
Measures of center and variation provide insights into the distribution and spread of data.
Mean, Median, Mode: Central tendency measures.
Range, Variance, Standard Deviation: Measures of spread.
Midrange: Average of the maximum and minimum values.
Describing Data: Percentiles, Quartiles, and Boxplots
Percentiles and quartiles divide data into segments, and boxplots visually summarize these divisions.
Percentiles: Indicate the percentage of data below a certain value.
Quartiles: Q1 (25th percentile), Q2 (median), Q3 (75th percentile).
Boxplot: Shows median, quartiles, and outliers.
Describing Data: Identifying Outliers
Outliers are values that deviate significantly from the rest of the data and can affect statistical analyses.
Outlier Detection: - Use interquartile range (IQR): - Outliers are typically values below or above
Describing Data: Measures of Relative Standing
Relative standing measures indicate how a value compares to others in the data set.
Z-score: Number of standard deviations a value is from the mean.
Percentile Rank: Percentage of values below a given value.
Describing Data: Using Technology
Statistical software and calculators can be used to compute measures of center, variation, and create graphs.
Graphing Calculators: Useful for creating histograms, boxplots, and calculating statistics.
Statistical Software: Programs like Excel, SPSS, and R facilitate data analysis.
Summary Table: Levels of Measurement
The following table summarizes the four levels of measurement and their properties:
Level | Order | Equal Intervals | True Zero | Examples |
|---|---|---|---|---|
Nominal | No | No | No | Colors, Gender |
Ordinal | Yes | No | No | Rankings, Grades |
Interval | Yes | Yes | No | Temperature (Celsius) |
Ratio | Yes | Yes | Yes | Height, Weight |
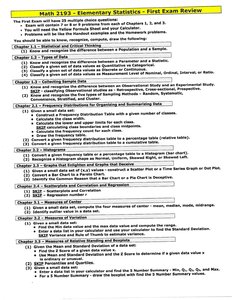
Relevant Image
The following image provides a visual summary of the exam review topics, including chapter breakdowns and key concepts for Math 2193 - Elementary Statistics: