 Back
Measures of Center and Variation in Introductory Statistics
Study Guide - Smart Notes
 Tailored notes based on your materials, expanded with key definitions, examples, and context.
Chapter 3: Describing, Exploring, and Comparing Data
Measures of Center
Measures of center are statistical values that describe the central tendency of a data set. These values help summarize a large set of data with a single representative number. The most common measures of center are the mean, median, mode, and midrange.
Mean (Arithmetic Mean): The mean is the sum of all data values divided by the number of values. It is sensitive to extreme values (outliers), which can distort its representation of the data set. Sample mean: Population mean: Example: For the weights of 11 players: 206, 208, 256, 237, 306, 262, 301, 239, 256, 188, 301, the mean is calculated as .
Resistant Measure: A measure is resistant if it is not affected by extreme values. The mean is not resistant, while the median is.
Median: The median is the middle value when the data is ordered. If there is an even number of values, it is the average of the two middle values. Example: For the same weights, arrange them in order and find the middle value.
Mode: The mode is the value that occurs most frequently in the data set. Example: In the weights data, 301 appears twice, so the mode is 301.
Midrange: The midrange is the average of the maximum and minimum values. Formula:
Round-Off Rules: When reporting measures of center, round to one more decimal place than the original data.
Mean from a Frequency Distribution: When data is grouped, the mean can be calculated using the midpoints and frequencies. Formula: Example: For time intervals and frequencies:
Time (seconds)
Frequency (f)
75 – 124
11
125 – 174
24
175 – 224
10
225 – 274
3
275 – 324
2
Total
50
Weighted Mean: Used when values have different weights (e.g., grades and credits). Formula: Example: Ana's GPA: Assign quality points to grades and multiply by credits, then divide by total credits.
Additional info: The TI-84 calculator can be used to compute these measures by entering data into lists and using built-in functions for mean, median, and mode.
Measures of Variation
Measures of variation describe how spread out the data values are. They provide insight into the consistency and reliability of the data set. The most common measures are range, standard deviation, and variance.
Range: The difference between the maximum and minimum values. Formula: Example: For data: 38.5, 55.6, 22.4, 14.1, 23.1, the range is .
Standard Deviation (s): Measures the average distance of each data value from the mean. It is always positive or zero. Formula (sample): Formula (population): Example: Calculate for the Verizon data speeds.
Variance: The square of the standard deviation. Sample variance: Population variance: Units: Variance is expressed in the units squared.
Range Rule of Thumb: Used to estimate the usual minimum and maximum values and to approximate the standard deviation. Rule: About 95% of values fall within two standard deviations of the mean. Formula:
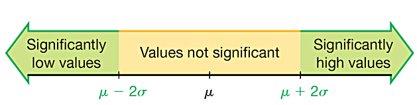
Estimating Standard Deviation: To estimate, use .
Coefficient of Variation (CV): Compares the standard deviation relative to the mean, useful for comparing variability between different data sets. Formula:
Additional info: The coefficient of variation is especially useful when comparing data sets with different units or means.
Summary Table: Measures of Center and Variation
Measure | Definition | Formula | Resistant? |
|---|---|---|---|
Mean | Average of all values | No | |
Median | Middle value | - | Yes |
Mode | Most frequent value | - | Yes |
Midrange | Average of max and min | No | |
Range | Difference between max and min | No | |
Standard Deviation | Average distance from mean | No | |
Variance | Square of standard deviation | No | |
Coefficient of Variation | Relative variation | No |
