 Back
BackMeasures of Center in Statistics: Mean, Median, Mode, and Midrange
Study Guide - Smart Notes
 Tailored notes based on your materials, expanded with key definitions, examples, and context.
Measures of Center
Introduction
Measures of center are fundamental statistics used to describe the central tendency of a data set. The most common measures are the mean, median, mode, and midrange. Understanding these helps in summarizing and interpreting data effectively. This section also introduces notation differences between statistics (sample) and parameters (population).
Population and Sample Size
Population Size (N): The total number of items in a population.
Sample Size (n): The total number of items in a sample.
These notations are essential for distinguishing between calculations based on the entire population and those based on a sample.
Mean (Average)
The mean is the balancing point of a data set, calculated by summing all values and dividing by the number of values. It is sensitive to extreme values (outliers).
Formula:
Rounding Rule: Always round statistics to one more decimal place than is present in the data.
Example: If the sum of ages for 44 students is 1160, then (rounded to one decimal place).
The mean is often used as a representative value, but may not always be appropriate for skewed distributions.
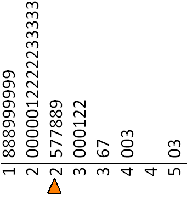
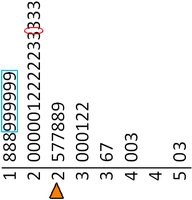
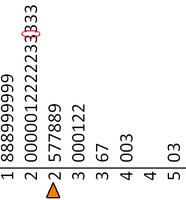
Median
The median is the middle value of an ordered data set. It is less affected by outliers and skewed data.
Finding the Median: Arrange data in order. If n is odd, the median is the center value. If n is even, the median is the average of the two middle values.
Example: For 44 values, the median is halfway between the 22nd and 23rd values.
Mode
The mode is the most frequently occurring value in a data set. It is useful for categorical data and can be non-existent or have multiple values (bimodal).
Example: In a sample of ages, if 19 years occurs most frequently, then Mode = 19.0.
Note: A data set with two modes is called bimodal.
Midrange
The midrange is the value halfway between the maximum and minimum values in a data set. It is highly sensitive to outliers and rarely used in practice.
Formula:
Example: If the minimum age is 18 and the maximum is 35, then .
Comparing Measures of Center
The best measure of center depends on the shape of the distribution.
Symmetric Distributions
For symmetric distributions, all measures of center coincide or are close together.
Mean: Balancing point
Median: Middle value
Mode: Highest frequency
Midrange: Halfway between edges
Skewed Distributions
For skewed distributions, the measures of center differ significantly.
Right-skewed (positively skewed): Mode < Median < Mean < Midrange
Left-skewed (negatively skewed): Midrange < Mean < Median < Mode
Resistance to Outliers
Midrange: Least resistant
Mean: Somewhat resistant
Median: Most resistant
Mode: Most resistant
Because the midrange is unstable, it is rarely used. The mean is also unstable in the presence of outliers, so the median is often reported for skewed data.
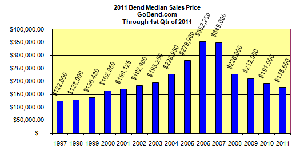
Median Sale Price Example
The median is commonly used in reporting real estate prices, as it is less affected by extreme values than the mean.
Weighted Mean
The weighted mean is used when different values have different levels of importance or frequency. It is common in grading systems and other applications where contributions are not equal.
Formula:
Example: If a student's grades are weighted as follows: Homework 15%, Quizzes 15%, Exam 1 20%, Exam 2 20%, Final 30%, and scores are 95, 90, 80, 70, 60 respectively, the weighted mean is calculated by multiplying each score by its weight and summing, then dividing by the total weight.
Category | Weight (w) | Data Value (x) | w x |
|---|---|---|---|
Homework | 0.15 | 95 | 14.25 |
Quizzes | 0.15 | 90 | 13.5 |
Exam 1 | 0.20 | 80 | 16 |
Exam 2 | 0.20 | 70 | 14 |
Final | 0.30 | 60 | 18 |
Total | 1.00 | 75.75 |
Weighted Mean =
Additional info: The weighted mean is especially useful in situations where some data points contribute more to the overall average than others, such as in academic grading or economic indices.
