 Back
BackMeasures of Central Tendency: Mean, Median, and Mode
Study Guide - Smart Notes
 Tailored notes based on your materials, expanded with key definitions, examples, and context.
Measures of Central Tendency
Definition and Importance
Measures of central tendency are statistical values that represent the center or typical value of a dataset. The three most common measures are the mean, median, and mode. Each measure uses a different method to determine the central location, and the choice of which to use depends on the nature of the data.
Mean: The arithmetic average of all values.
Median: The middle value when data are ordered.
Mode: The value that appears most frequently.
These measures are essential because they provide a summary value that helps describe the overall distribution of data, making it easier to compare and interpret datasets.
Applications and Usefulness
Measures of central tendency are useful for summarizing large datasets with a single value, which helps in decision-making and data analysis. For example, when comparing home prices across neighborhoods, knowing the average price allows for quick identification of areas within a specific budget.
Example: A couple searching for a home can use the average price in each neighborhood to narrow their search efficiently.
Calculating Measures of Central Tendency
Mean
The mean is calculated by summing all values and dividing by the number of values:
Example: If the home run counts for 10 players are added together and divided by 10, the result is the mean number of home runs.
Median
The median is the middle value in an ordered dataset:
If the number of values (n) is odd, the median is the value.
If n is even, the median is the average of the and values.
Example: Arrange the home run counts in order and find the middle value(s) to determine the median.
Mode
The mode is the value that occurs most frequently in a dataset. A dataset can have no mode, one mode, or multiple modes.
Example: In a dataset of home run counts, if 8, 15, and 19 each appear most frequently, the dataset is multimodal.
The mode is especially useful for categorical data, such as survey responses for favorite color.
Choosing the Appropriate Measure
When to Use the Mean
The mean is best used when the data distribution is symmetrical and free of outliers. In such cases, the mean accurately represents the central value.
Example: In a town where salaries are symmetrically distributed without extreme values, the mean salary is a good indicator of the typical salary.
When to Use the Median
The median is preferred when the data are skewed or contain outliers, as it is less affected by extreme values than the mean.
Example: In a salary distribution with a long tail of high salaries, the median better represents the typical salary than the mean, which can be pulled upward by outliers.
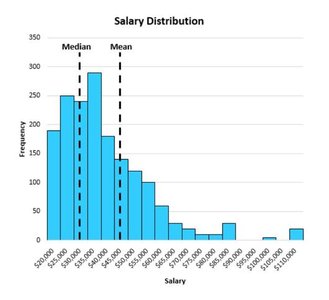
Additional info: The image above illustrates a right-skewed salary distribution, where the mean is higher than the median due to the influence of high outlier salaries.
When to Use the Mode
The mode is most useful for categorical data, where it identifies the most common category. For numerical data, the mode is less informative about the typical value, especially if the dataset is multimodal or if the mode is an outlier.
Example: In a survey of favorite colors, the mode indicates the most popular color.
For numerical data, the mode may not always represent the center of the data well.
Formulas for Grouped and Ungrouped Data
Mean
Ungrouped data:
Grouped data: Where is the midpoint of each class, is the frequency, and is the total frequency.
Median
Ungrouped data:
If is odd: value
If is even:
Grouped data: Where is the lower limit of the median class, is the total frequency, is the cumulative frequency before the median class, is the frequency of the median class, and is the class width.
Mode
Ungrouped data: The value that appears most frequently.
Grouped data: Where is the lower limit of the modal class, is the class interval size, is the frequency of the modal class, is the frequency of the class before the modal class, and is the frequency of the class after the modal class.
Summary Table: When to Use Each Measure
Measure | Best Used For | Limitations |
|---|---|---|
Mean | Symmetrical, outlier-free data | Affected by outliers and skewed data |
Median | Skewed data or data with outliers | Does not use all data values |
Mode | Categorical data | May not represent central value for numerical data |
Key Takeaways
Measures of central tendency summarize data with a single value.
The mean, median, and mode each have specific scenarios where they are most appropriate.
Understanding the data distribution is crucial for selecting the best measure.
