 Back
BackMeasures of Position: Z-Scores, Percentiles, Quartiles, and Boxplots
Study Guide - Smart Notes
 Tailored notes based on your materials, expanded with key definitions, examples, and context.
Measures of Position
Z-Scores
The z-score (also called the standard score or standardized value) is a statistical measure that describes a value's position relative to the mean of a data set, expressed in terms of standard deviations. Z-scores are useful for comparing values from different data sets or distributions.
Definition: The z-score for a value x is the number of standard deviations x is above or below the mean.
Formula: where is the value, is the sample mean, and is the sample standard deviation.
Properties:
Z-scores are unitless (no units of measurement).
A z-score less than or equal to -2 indicates a significantly low value.
A z-score greater than or equal to +2 indicates a significantly high value.
If a value is less than the mean, its z-score is negative.
Example: Comparing extremeness of two values:
99°F temperature among adults (°F, °F)
5.7790 g weight of a quarter ( g, g)
Calculate z-scores for each to determine which is more extreme relative to its data set.
Percentiles
Percentiles are measures of location that divide a data set into 100 equal groups, with about 1% of the values in each group. They are denoted as .
Notation:
n: Total number of values in the data set
k: Percentile being used (e.g., for the 25th percentile, )
L: Locator that gives the position of a value (e.g., for the 12th value in the sorted list, )
: The kth percentile (e.g., is the 25th percentile)
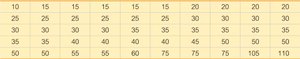
Application Example: Determining what percentile a wait time of 45 minutes represents in a data set of Space Mountain wait times.
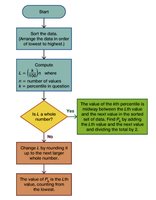
Finding a Percentile in a Data Set
To find the value corresponding to a given percentile in a data set, follow these steps:
Sort the data in ascending order.
Compute the locator using the formula: where is the desired percentile and is the number of data values.
If is a whole number, the percentile is the average of the $L$th and th values.
If is not a whole number, round up to the next integer; the percentile is the value at that position.
Quartiles
Quartiles are special percentiles that divide a data set into four equal groups, each containing about 25% of the values. The three quartiles are:
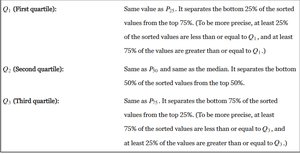
Q1 (First Quartile): Same as . Separates the lowest 25% from the highest 75% of values.
Q2 (Second Quartile): Same as and the median. Separates the lowest 50% from the highest 50% of values.
Q3 (Third Quartile): Same as . Separates the lowest 75% from the highest 25% of values.
5-Number Summary
The 5-number summary provides a concise description of a data set using five key values:
Minimum
First quartile ()
Second quartile ( or median)
Third quartile ()
Maximum
This summary is especially useful for understanding the spread and center of the data, and for constructing boxplots.
Boxplot (Box-and-Whisker Diagram)
A boxplot is a graphical representation of the 5-number summary. It displays the distribution of a data set by showing the minimum, first quartile, median, third quartile, and maximum. The box represents the interquartile range (IQR), and the 'whiskers' extend to the minimum and maximum values.
Purpose: To visualize the spread, center, and skewness of the data, and to identify potential outliers.
Example: Boxplot of Space Mountain wait times at 10AM.
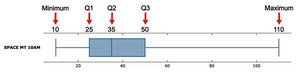
Interpretation: The boxplot shows the minimum (10), (25), median (, 35), (50), and maximum (110) wait times, allowing for quick assessment of data distribution and variability.
