 Back
BackMeasures of Regression and Prediction Intervals: Variation, Coefficient of Determination, and Standard Error of Estimate
Study Guide - Smart Notes
 Tailored notes based on your materials, expanded with key definitions, examples, and context.
Correlation and Regression
Measures of Regression and Prediction Intervals
This section explores the quantitative assessment of how well a regression line fits a set of data. It covers the types of variation about a regression line, the coefficient of determination, and the standard error of estimate, all of which are essential for interpreting linear regression results in statistics.
Variation About a Regression Line
Types of Variation
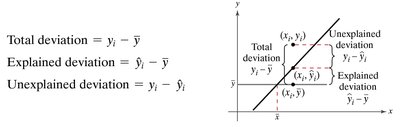
Variation about a regression line is divided into three main types, each representing a different aspect of how data points deviate from the regression model:
Total Variation: The sum of the squares of the differences between each observed y-value and the mean of y. It quantifies the overall spread of the data.
Explained Variation: The sum of the squares of the differences between each predicted y-value (from the regression line) and the mean of y. It measures how much of the total variation is accounted for by the regression model.
Unexplained Variation: The sum of the squares of the differences between each observed y-value and its corresponding predicted y-value. It represents the portion of variation not explained by the regression model.
For each ordered pair in a data set, the following deviations are calculated:
Total deviation:
Explained deviation:
Unexplained deviation:
Formulas:
Total variation:
Explained variation:
Unexplained variation:
Total variation = Explained variation + Unexplained variation
Coefficient of Determination
Definition and Interpretation
The coefficient of determination, denoted as , is a statistical measure that quantifies the proportion of the total variation in the dependent variable that is explained by the regression model. It is calculated as:
Interpretation: An value close to 1 indicates that most of the variation in the dependent variable is explained by the regression model, while a value close to 0 indicates little explanatory power.
Example: In a study of children's vocabulary size and age, means that 96.4% of the variation in vocabulary size is explained by age, and 3.6% is unexplained.
Application Example:
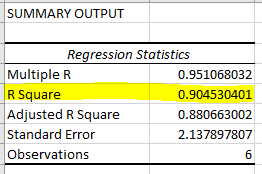
Given data for building heights and number of stories, indicates that 90.5% of the variation in stories is explained by height.
Standard Error of Estimate
Definition and Calculation
The standard error of estimate () measures the average distance that the observed values fall from the regression line. It is the standard deviation of the observed values about the predicted values for a given value. The formula is:
Interpretation: The smaller the standard error, the closer the data points are to the regression line, indicating a better fit.
Calculation Steps:
Make a table with columns for , , , , and .
Use the regression equation to calculate predicted values.
Sum the squared differences .
Apply the formula to find .
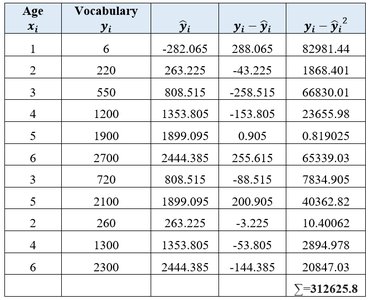
Example: For children's age and vocabulary size, . This means the average distance from the regression line is about 186 vocabulary size units.
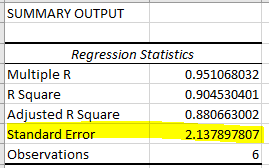
Excel Application: For building heights and stories, the standard error of estimate is 2.138, meaning the average distance from the regression line is about 2.138 stories.
Summary Table: Variation and Regression Measures
Measure | Formula | Interpretation |
|---|---|---|
Total Variation | Overall spread of data | |
Explained Variation | Variation explained by regression | |
Unexplained Variation | Variation not explained by regression | |
Coefficient of Determination () | Proportion of explained variation | |
Standard Error of Estimate () | Average distance from regression line |
Practice Example: Coefficient of Determination
Sample Calculation
Given temperature () and number of ice cream cones sold per hour ():
Data: ;
Possible values: 0.946, 0.973, 0.923, 0.986
Interpretation: The correct value indicates the proportion of variation in ice cream sales explained by temperature.
Additional info: These measures are fundamental for evaluating the effectiveness of linear regression models in statistics, and are directly relevant to Chapter 9: Correlation and Regression.
