 Back
Measures of Variation and Relative Standing in Statistics
Study Guide - Smart Notes
 Tailored notes based on your materials, expanded with key definitions, examples, and context.
Describing, Exploring, and Comparing Data
Measures of Variation
Measures of variation, also known as measures of dispersion, provide insight into how data values are spread out within a dataset. The most common measures are range, variance, and standard deviation.
Range: The difference between the highest and lowest values in a dataset. Formula:
Variance: The average of the squared differences from the mean. It quantifies the spread of data points. Population Variance: Sample Variance:
Standard Deviation: The square root of the variance. It measures the average distance of each data point from the mean. Population Standard Deviation: Sample Standard Deviation:
Interpretation: A small standard deviation indicates that data points are close to the mean, while a large standard deviation shows that data points are spread out.
Example: Calculating Sample Standard Deviation
Given sample wait times: 4.2, 5.4, 5.8, 6.2, 6.7, 7.7, 7.7, 8.5, 9.3, 10
Mean:
Sample Standard Deviation:
Uses of the Standard Deviation
Standard deviation is used to analyze the distribution of data. Three main rules are applied:
Range Rule of Thumb: Standard deviation is roughly one-fourth of the range. Formula:
Chebyshev's Theorem: For any dataset (regardless of shape), at least of the data lies within standard deviations of the mean, where .
Empirical Rule: For bell-shaped (normal) distributions:
68% of values within 1 SD of the mean
95% within 2 SD
99.7% within 3 SD
Empirical Rule Visualization:
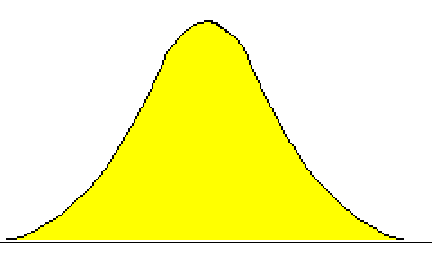
In a normal distribution, about 68% of the data falls within 1 SD of the mean, 95% within 2 SD, and 99.7% within 3 SD.
Example: Empirical Rule Application
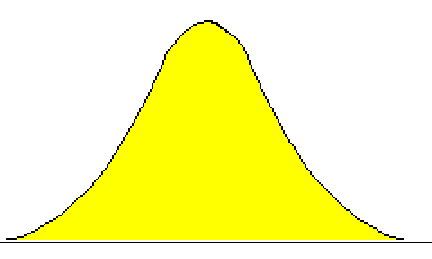
Given mean and standard deviation :
200 to 240 min (): 68% of runners
180 to 260 min (): 95% of runners
160 to 280 min (): 99.7% of runners
Calculating Standard Deviation by Hand
To understand the formula, follow these steps:
Calculate the mean
Find each data item's deviation from the mean
Square each deviation
Sum the squared deviations (sum of squares)
Divide by (sample) or (population) to find variance
Take the square root to find standard deviation
Example: For scores 85, 90, 92, 88, 95, mean , variance , standard deviation .
Measures of Relative Standing and Box Plots
Measures of Relative Standing
Measures of relative standing indicate the position of a data value within a dataset. The most common is the z-score.
Z-Score: The number of standard deviations a data value is from the mean. Population: Sample:
Interpretation: Positive z-scores indicate values above the mean; negative z-scores indicate values below the mean.
Example: Comparing Relative Positions
Calculus test: score 65, mean 50, SD 10: History test: score 30, mean 25, SD 5: The calculus score is relatively higher.
Significance of Z-Scores
Z-scores can be used to identify significant values:
Not Significant/Usual:
Significant/Unusual: or
Possible Outlier: or
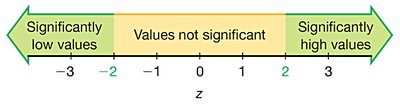
This scale shows how z-scores classify values as usual, significant, or outliers.
Key Concepts for Exam I
Measures of Center: Mean, Median, Mode
Measures of Variation: Range, Variance, Standard Deviation (including Range Rule of Thumb, Chebyshev’s Theorem, Empirical Rule)
Measures of Relative Standing/Position: Z Score
