 Back
BackMeasures of Variation in Statistics: Range, Standard Deviation, Variance, and Related Rules
Study Guide - Smart Notes
 Tailored notes based on your materials, expanded with key definitions, examples, and context.
Measures of Variation
Range
The range is the simplest measure of variation in a data set. It is calculated as the difference between the maximum and minimum values:
Definition: Range = Maximum value − Minimum value
Sensitivity: The range is highly sensitive to extreme values (outliers) and does not reflect the variation among all data points.
Limitation: Since it only uses two values, it is not resistant and may not accurately represent the spread of the data.
Standard Deviation
The standard deviation (denoted by s for sample, σ for population) measures how much data values deviate from the mean. It is a widely used indicator of variability.
Definition: Standard deviation quantifies the average distance of each data point from the mean.
Properties:
The standard deviation is always non-negative.
It is zero only when all data values are identical.
Larger values indicate greater variation.
It is sensitive to outliers.
The units of standard deviation match those of the original data.
The sample standard deviation (s) is a biased estimator of the population standard deviation (σ).
Formula for Sample Standard Deviation
Formula for Population Standard Deviation
Range Rule of Thumb
The range rule of thumb is a simple method for interpreting standard deviation. For many data sets, most values lie within two standard deviations of the mean:
Significantly low values: or lower
Significantly high values: or higher
Values not significant: Between and
To estimate the standard deviation from sample data, divide the range by 4:
Estimation:
Variance
The variance is another measure of variation, defined as the square of the standard deviation.
Sample variance: square of the sample standard deviation
Population variance: square of the population standard deviation
The Empirical Rule
The Empirical Rule applies to data sets with a bell-shaped (normal) distribution:
About 68% of values fall within 1 standard deviation of the mean
About 95% of values fall within 2 standard deviations of the mean
About 99.7% of values fall within 3 standard deviations of the mean
Chebyshev's Theorem
Chebyshev's Theorem applies to any data set, regardless of distribution:
The proportion of values within K standard deviations of the mean is at least for any K > 1.
For K = 2: At least 75% of values lie within 2 standard deviations.
For K = 3: At least 89% of values lie within 3 standard deviations.
Visualizing Variation: Histograms and Dot Plots
Visual representations such as histograms and dot plots help illustrate the spread and variation in data sets. For example, comparing the volume of regular and special cola using these plots can reveal differences in variability and distribution.
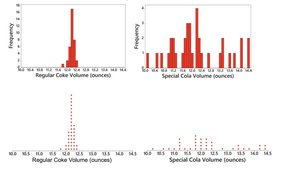
Interpretation: The histograms and dot plots above show the frequency and spread of cola volumes for two types. The regular cola appears to have less variation (more concentrated values), while the special cola shows greater spread and more variability.
