 Back
BackMidterm Exam 2 Study Guide – STAT211 Statistics I
Study Guide - Smart Notes
 Tailored notes based on your materials, expanded with key definitions, examples, and context.
Q1. If a random variable can take all natural numbers (1, 2, 3, 4, …), it is a ( )
Background
Topic: Types of Random Variables
This question tests your understanding of the difference between discrete and continuous random variables.
Key Terms:
Discrete random variable: Takes countable values (like 1, 2, 3, ...).
Continuous random variable: Takes any value within an interval (like all real numbers between 0 and 1).
Step-by-Step Guidance
Recall the definition of a discrete random variable: it can take a finite or countably infinite set of values.
Recall the definition of a continuous random variable: it can take any value in a continuous range.
Consider whether the set of natural numbers (1, 2, 3, ...) is countable or uncountable.
Try solving on your own before revealing the answer!
Final Answer: Discrete random variable
Natural numbers are countable, so the random variable is discrete.
Q2. If a random variable is approximately normal, then ( )
Background
Topic: Properties of the Normal Distribution
This question tests your knowledge of ratios involving range, interquartile range, variance, and standard deviation for normal distributions.
Key Terms:
Range: Difference between maximum and minimum values.
Interquartile range (IQR): Difference between the 75th and 25th percentiles.
Variance: Measure of spread, calculated as the average squared deviation from the mean.
Standard deviation: Square root of variance.
Step-by-Step Guidance
Recall the properties of the normal distribution, especially the relationship between IQR and standard deviation.
Consider the approximate value of IQR for a normal distribution: .
Review the answer choices and identify which ratio matches this property.
Try solving on your own before revealing the answer!
Final Answer: D. The ratio of interquartile range and standard deviation is approx. 1.35
For a normal distribution, the IQR is about 1.35 times the standard deviation.
Q3. Which two of the following statements correctly describe sample distribution and sampling distribution?
Background
Topic: Sampling Distribution vs. Sample Distribution
This question tests your understanding of the difference between the distribution of values within a sample and the distribution of a statistic across many samples.
Key Terms:
Sample distribution: Distribution of values within a single sample.
Sampling distribution: Distribution of a statistic (like the mean) across many samples from a population.
Step-by-Step Guidance
Review the definitions of sample distribution and sampling distribution.
Identify which statements refer to the distribution of values within a single sample and which refer to the distribution of a statistic across many samples.
Eliminate statements that are incorrect or misleading (e.g., "sampling distribution always follows a normal distribution" is not always true).
Try solving on your own before revealing the answer!
Final Answer: B and C
B describes the sampling distribution, and C describes the sample distribution.
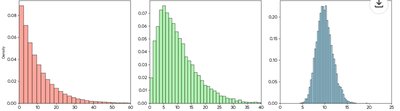
Q4. A researcher is studying the lifespan of a certain species of insect, taking thousands of random samples from this population, calculates the mean of each sample, and plots the distributions of population, and these sample means.
Background
Topic: Central Limit Theorem and Sampling Distributions
This question tests your understanding of how the shape of the distribution changes as you take sample means with different sample sizes.
Key Terms:
Population distribution: The distribution of all values in the population.
Sampling distribution of the mean: The distribution of sample means for a given sample size.
Central Limit Theorem (CLT): States that the sampling distribution of the sample mean approaches normality as sample size increases, regardless of the population's shape.
Step-by-Step Guidance
Examine the three distributions shown in the image: one is the population, one is the sample mean for n=2, and one is the sample mean for n=30.
Recall that the population distribution may be skewed or non-normal.
For small sample sizes (n=2), the sampling distribution of the mean will resemble the population distribution.
For larger sample sizes (n=30), the sampling distribution of the mean will be approximately normal, according to the Central Limit Theorem.
Identify which graph corresponds to each distribution based on shape: skewed (population), less skewed (n=2), and normal (n=30).
Try solving on your own before revealing the answer!
Final Answer:
Population: A (left), Sample mean n=2: B (middle), Sample mean n=30: C (right)
The fundamental principle is the Central Limit Theorem, which explains why the sampling distribution of the mean becomes normal as sample size increases.
Q5. If P(A)=0.4, and P(B)=0.3, can A and B be mutually exclusive? Why or why not?
Background
Topic: Probability and Mutually Exclusive Events
This question tests your understanding of mutually exclusive events and their probabilities.
Key Terms:
Mutually exclusive events: Events that cannot occur at the same time.
Probability: The likelihood of an event occurring.
Step-by-Step Guidance
Recall that for mutually exclusive events, .
Recall that for mutually exclusive events.
Consider whether can exceed 1.
Check if is less than or equal to 1.
Try solving on your own before revealing the answer!
Final Answer: Yes, A and B can be mutually exclusive.
Since , it is possible for A and B to be mutually exclusive.
Q6. If a random variable is uniformly distributed from 4 to 10, get the mean and standard deviation of it.
Background
Topic: Uniform Distribution
This question tests your ability to calculate the mean and standard deviation for a continuous uniform distribution.
Key Formulas:
Mean:
Standard deviation:
Step-by-Step Guidance
Identify the endpoints: , .
Plug these values into the mean formula: .
Plug these values into the standard deviation formula: .
Try solving on your own before revealing the answer!
Final Answer: Mean = 7, Standard deviation = 1.73
Using the formulas, the mean is 7 and the standard deviation is approximately 1.73.
Q7. At one intersection in the city, the number of stop sign tickets in a day follows a Poisson distribution with , and the time in between stop sign tickets follows an exponential distribution with hours.
Background
Topic: Poisson and Exponential Distributions
This question tests your ability to use the Poisson distribution for counts and the exponential distribution for waiting times.
Key Formulas:
Poisson probability:
Exponential probability:
Step-by-Step Guidance
For part A, use the Poisson formula to find the probability of at least 6 tickets: .
Calculate using the Poisson cumulative formula with .
For part B, use the exponential formula to find the probability that the next ticket is issued within 5 hours: .
Try solving on your own before revealing the answer!
Final Answer:
A: using Poisson with .
B: using exponential with .
Q8. At a local coffee house, 80% of coffee buyers will choose regular coffee, and 20% will choose decaf.
Background
Topic: Binomial Distribution
This question tests your ability to use the binomial distribution to calculate probabilities for a fixed number of trials.
Key Formula:
Binomial probability:
Step-by-Step Guidance
For part A, set , , .
Plug these values into the binomial formula: .
For part B, set , , and calculate .
Use the binomial formula for to and sum the probabilities.
Try solving on your own before revealing the answer!
Final Answer:
A:
B:
Q9. There are 4 dimes (10 cents) and 2 nickels (5 cents) in a box. 3 coins are randomly selected without replacement.
Background
Topic: Combinatorics and Probability
This question tests your ability to calculate probabilities and distributions for random draws without replacement.
Key Terms:
Without replacement: Once a coin is drawn, it is not returned to the box.
Probability: Number of favorable outcomes divided by total outcomes.
Step-by-Step Guidance
List all possible combinations of 3 coins from 6 coins (4 dimes, 2 nickels).
Calculate the total number of ways to choose 3 coins: .
For part A, identify combinations that sum to 20 cents (e.g., 2 dimes + 1 nickel).
Count the number of favorable combinations and divide by the total number of combinations.
For part B, list all possible sums and their probabilities.
Try solving on your own before revealing the answer!
Final Answer:
A: Probability = Number of favorable combinations / Total combinations
B: Distribution: List all possible sums (15, 20, 25, 30) and their probabilities.
Q10. The following Venn diagram shows the 9th grade students participate in two clubs (B & C). One student from the grade is randomly selected.
Background
Topic: Probability, Conditional Probability, Independence
This question tests your ability to use Venn diagrams to calculate probabilities and test for independence.
Key Terms:
Venn diagram: Visual representation of sets and their intersections.
Conditional probability: Probability of one event given another.
Independence: Two events are independent if .
Step-by-Step Guidance
Identify the numbers in each region of the Venn diagram (e.g., only B, only C, both, neither).
For part A, calculate the probability of being in both clubs: .
For part B, calculate the conditional probability: .
For part C, calculate the probability of being in neither club.
For part D, check independence: ?
Try solving on your own before revealing the answer!
Final Answer:
A:
B:
C:
D: Check if for independence.
Q11. Men’s shirt sizes are determined by their neck size. Suppose that men’s neck sizes are approx. normally distributed with mean 15.7 inches and standard deviation 0.7 inch. Shirt sizes are defined as: S: 14 ≤ Size <15, M: 15 ≤ Size <16, L: 16 ≤ Size <17, XL: 17 ≤ Size <18.
Background
Topic: Normal Distribution and Binomial Probability
This question tests your ability to use the normal distribution to find proportions and the binomial distribution for probabilities.
Key Formulas:
Normal probability:
Binomial probability:
Step-by-Step Guidance
For part A, calculate the proportion of men with neck size between 15 and 16 inches using the normal distribution.
Find the z-scores for 15 and 16 inches: , .
Use the standard normal table to find the probabilities for these z-scores.
For part B, use the binomial formula with , proportion from part A, .
For part C, find the neck size corresponding to the 95th percentile and determine the shirt size.
Try solving on your own before revealing the answer!
Final Answer:
A: Proportion = using normal distribution.
B:
C: 95th percentile neck size = ; check which shirt size interval this falls into.
Q12. An American roulette wheel has 18 red, 18 black and 2 green slots. You bet $1 on red color. If the winning number is red, you win $1, and your original $1 is returned, if the winning number is not red, you lose your original $1. Use X to denote the NET gain (in dollars) you have each time you play the roulette.
Background
Topic: Expected Value and Probability Distribution
This question tests your ability to construct a probability distribution and calculate expected value.
Key Formulas:
Expected value:
Probability of winning:
Probability of losing:
Step-by-Step Guidance
List possible outcomes: win $1, lose $1.
Assign probabilities: , .
Write the distribution of X.
Calculate expected value: .
For part B, multiply expected value by 80 plays.
For part C, use normal approximation for the sum of 80 plays and calculate the probability that average net gain is greater than 0.
Try solving on your own before revealing the answer!
Final Answer:
A: Distribution: , ; Expected value:
B: Expected gain/loss =
C: Use normal approximation to find
