 Back
BackMini-Textbook Study Notes: Hypothesis Testing in Statistics
Study Guide - Smart Notes
 Tailored notes based on your materials, expanded with key definitions, examples, and context.
Basics of Hypothesis Testing
Introduction to Hypothesis Testing
Hypothesis testing is a fundamental procedure in inferential statistics, used to evaluate claims or statements about a population parameter based on sample data. The process involves formulating two competing hypotheses and using statistical evidence to determine which is more consistent with the observed data.
Hypothesis: A claim or statement about a property of a population (e.g., mean, proportion).
Hypothesis Test (Test of Significance): A systematic procedure for testing a claim about a population property using sample data.
Procedure for a Hypothesis Test
General Steps in Hypothesis Testing
The hypothesis testing process follows a structured sequence of steps to ensure objectivity and reproducibility. The main steps are:
State the null and alternative hypotheses.
Select the significance level (α).
Identify the appropriate test statistic and its sampling distribution.
Determine the critical region(s) or calculate the p-value.
Make a decision to reject or fail to reject the null hypothesis.
Restate the conclusion in nontechnical terms.

Null and Alternative Hypotheses
Formulating Hypotheses
Every hypothesis test begins with two competing statements:
Null Hypothesis (H0): The statement being tested, usually representing no effect or status quo.
Alternative Hypothesis (H1 or Ha): The statement we consider if the evidence suggests H0 is unlikely.
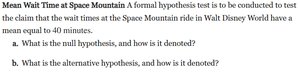
Example: Testing the mean wait time at Space Mountain.
H0: μ = 40 minutes
H1: μ ≠ 40 minutes (for a two-tailed test)
Significance Level (α)
Choosing the Significance Level
The significance level, denoted by α, is the probability of making a Type I error (rejecting a true null hypothesis). Common values are 0.05 and 0.01. The choice of α depends on the consequences of making such an error.
Smaller α reduces the risk of Type I error but may increase Type II error.
Typical values: 0.05 (5%), 0.01 (1%).
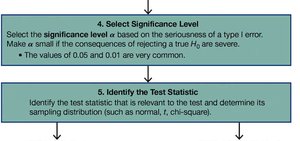
Identifying the Test Statistic
Test Statistic and Sampling Distribution
The test statistic is a standardized value calculated from sample data, used to decide whether to reject H0. The choice of test statistic depends on the type of data and hypothesis (e.g., z, t, chi-square).
Common test statistics: z (for large samples or known σ), t (for small samples or unknown σ), χ² (for categorical data).
The sampling distribution describes the probability distribution of the test statistic under H0.
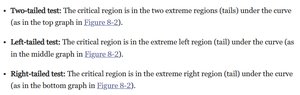
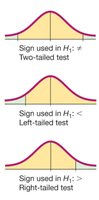
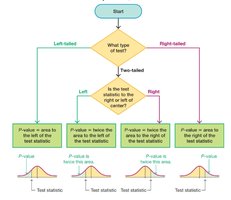
Critical Regions and Tails of the Test
Types of Tests and Critical Regions
The critical region is the set of values for the test statistic that leads to rejection of H0. The location and number of critical regions depend on the alternative hypothesis:
Two-tailed test: Critical regions in both extremes (tails) of the distribution; H1: μ ≠ μ0.
Left-tailed test: Critical region in the extreme left tail; H1: μ < μ0.
Right-tailed test: Critical region in the extreme right tail; H1: μ > μ0.
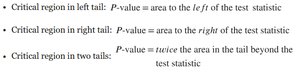
P-Value Method
Calculating and Interpreting the P-Value
The p-value is the probability, assuming H0 is true, of obtaining a result as extreme or more extreme than the observed test statistic. The decision rule is:
If p-value ≤ α, reject H0.
If p-value > α, fail to reject H0.
The calculation of the p-value depends on the type of test:
Left-tailed: p-value = area to the left of the test statistic.
Right-tailed: p-value = area to the right of the test statistic.
Two-tailed: p-value = twice the area in the tail beyond the test statistic.
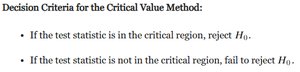
Critical Value Method
Using Critical Values to Make Decisions
The critical value method involves comparing the test statistic to a threshold (critical value) determined by α. The critical value separates the critical region from the non-critical region.
If the test statistic falls in the critical region, reject H0.
If the test statistic does not fall in the critical region, fail to reject H0.
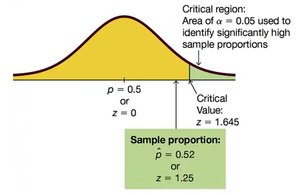
Decision Criteria for the Critical Value Method:
If the test statistic is in the critical region, reject H0.
If the test statistic is not in the critical region, fail to reject H0.
Confidence Interval Method
Using Confidence Intervals for Hypothesis Testing
A confidence interval estimates a population parameter. If the value specified in H0 is not included in the confidence interval, H0 is rejected at the corresponding significance level.
Significance Level for Hypothesis Test | Two-Tailed Test | One-Tailed Test |
|---|---|---|
0.01 | 99% | 98% |
0.05 | 95% | 90% |

Restating the Conclusion
Communicating Results in Nontechnical Terms
After making a statistical decision, it is important to restate the conclusion in simple, nontechnical language, directly addressing the original claim.
Errors in Hypothesis Testing
Types of Errors
Two types of errors can occur in hypothesis testing:
Type I Error: Rejecting a true null hypothesis (probability = α).
Type II Error: Failing to reject a false null hypothesis (probability = β).
Choosing a smaller α reduces the risk of a Type I error but may increase the risk of a Type II error.
Summary Table: Critical Regions and P-Values
Test Type | Critical Region Location | P-Value Calculation |
|---|---|---|
Left-tailed | Extreme left tail | Area to the left of the test statistic |
Right-tailed | Extreme right tail | Area to the right of the test statistic |
Two-tailed | Both extreme tails | Twice the area in the tail beyond the test statistic |
