 Back
BackMini-Textbook Study Notes: Hypothesis Testing with One Sample and Related Distributions
Study Guide - Smart Notes
 Tailored notes based on your materials, expanded with key definitions, examples, and context.
Hypothesis Testing with One Sample
Introduction to Hypothesis Testing
Hypothesis testing is a fundamental statistical method used to determine whether there is enough evidence in a sample of data to infer that a certain condition holds for the entire population. It involves comparing observed data to what is expected under a specific hypothesis.
Null Hypothesis (H0): The default assumption that there is no effect or no difference.
Alternative Hypothesis (H1 or Ha): The statement we are trying to find evidence for.
Test Statistic: A standardized value calculated from sample data, used to decide whether to reject H0.
p-value: The probability of obtaining a result at least as extreme as the observed one, assuming H0 is true.
Example: Testing whether the mean score of a sample differs from a known population mean.
Sampling Distributions and the Central Limit Theorem
Sampling Distributions
A sampling distribution is the probability distribution of a given statistic based on a random sample. The most common is the sampling distribution of the sample mean.
As the number of samples increases, the sampling distribution of the mean becomes more normal (Central Limit Theorem).
The mean of the sampling distribution equals the population mean.
The standard deviation of the sampling distribution is called the standard error.
Formula for Standard Error of the Mean:
Where is the population standard deviation and is the sample size.
Example: If and , then .
Confidence Intervals
Confidence intervals provide a range of values within which the population parameter is expected to lie with a certain probability (confidence level).
For a 95% confidence interval:
Example: For , , the 95% confidence interval is .
z-Test for a Single Sample Mean
When Population Standard Deviation is Known
The z-test is used when the population standard deviation () is known. It compares the sample mean to the population mean to determine if they are significantly different.
z-Test Statistic Formula:
If is greater than the critical value (e.g., 1.96 for 95% confidence), we reject H0.
p-values can be found using statistical tables or software (e.g., Excel's NORM.S.DIST function).
Example: Sample mean = 11.9, population mean = 10, , .
This z-value is much greater than 1.96, so the difference is significant.
z-Test for Proportions
Comparing Proportions
The z-test can also be used to compare sample proportions to a population proportion.
z-Test Statistic for Proportions:
= sample proportion
= population proportion
= sample size
Example: Population proportion = 0.37, sample proportion = 0.30, .
t-Test for a Single Sample Mean
When Population Standard Deviation is Unknown
When is unknown, the t-test is used. The t-distribution is similar to the normal distribution but has heavier tails, which accounts for extra uncertainty from estimating $\sigma$ with the sample standard deviation ().
Degrees of Freedom (df):
The critical value of t depends on df and the desired confidence level.
t-Test Statistic Formula:
Example: Sample mean = 12, population mean = 10, , .
Compare this value to the critical t-value from the t-table for (e.g., 2.262 for , two-tailed).
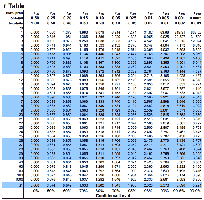
Additional info: The t-table provides critical values for different degrees of freedom and significance levels. Use the appropriate value for your test.
Chi-Square Test for Variance
Testing Variance
The chi-square () test is used to compare the variance of a sample to a known or hypothesized population variance. It is sensitive to normality assumptions.
Chi-Square Test Statistic:
Used to test if the sample variance is significantly different from the population variance.
The distribution is not symmetric and depends on the degrees of freedom ().
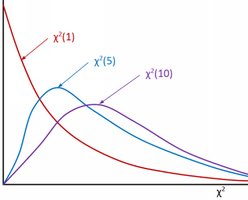
Additional info: The shape of the chi-square distribution changes with degrees of freedom. For small df, it is highly skewed; as df increases, it becomes more symmetric.
Summary Table: Key Hypothesis Tests
Test | When to Use | Test Statistic | Distribution |
|---|---|---|---|
z-test (mean) | Known | Normal | |
t-test (mean) | Unknown | t-distribution | |
z-test (proportion) | Proportions | Normal | |
Chi-square test | Variance | Chi-square |
Conclusion
Single-sample hypothesis tests are foundational tools in statistics, allowing researchers to make inferences about population parameters based on sample data. Understanding when and how to use z, t, and chi-square tests is essential for proper statistical analysis.
