 Back
BackModule 1 Test – Step-by-Step Statistics Guidance
Study Guide - Smart Notes
 Tailored notes based on your materials, expanded with key definitions, examples, and context.
Q1. Which of the following correctly describes the relationship between a parameter and a statistic?
Background
Topic: Parameters vs. Statistics
This question tests your understanding of the difference between a parameter (a value that describes a population) and a statistic (a value that describes a sample).
Key Terms:
Parameter: A numerical value that summarizes data for an entire population.
Statistic: A numerical value that summarizes data from a sample, which is a subset of the population.
Step-by-Step Guidance
Recall that a parameter describes a population, while a statistic describes a sample.
Think about how we use sample data to estimate unknown values about a population.
Review each answer choice and identify which one correctly states the relationship between statistics and parameters.
Try solving on your own before revealing the answer!
Q2. Identify the population in the study about average commute time for SPC students attending lecture classes.
Background
Topic: Populations and Samples
This question tests your ability to distinguish between the population and the sample in a statistical study.
Key Terms:
Population: The entire group that is the subject of a statistical study.
Sample: A subset of the population, selected for analysis.
Step-by-Step Guidance
Identify what group the researchers are interested in drawing conclusions about.
Notice that the sample consists of students from two specific lecture classes, but the population is broader.
Review the answer choices and determine which one best represents all individuals the study aims to generalize to.
Try solving on your own before revealing the answer!
Q3. Which branch of statistics deals with the organization and summarization of collected information?
Background
Topic: Branches of Statistics
This question tests your understanding of the difference between descriptive and inferential statistics.
Key Terms:
Descriptive Statistics: Methods for organizing, displaying, and summarizing data.
Inferential Statistics: Methods for making predictions or inferences about a population based on sample data.
Step-by-Step Guidance
Recall that descriptive statistics focus on summarizing data, while inferential statistics involve making predictions or generalizations.
Match the definition in the question to the correct branch of statistics.
Try solving on your own before revealing the answer!
Q4. Is the statement about predicting 19% voter turnout descriptive or inferential statistics?
Background
Topic: Descriptive vs. Inferential Statistics
This question tests your ability to distinguish between describing data and making predictions based on data.
Key Terms:
Descriptive Statistics: Summarizes or describes characteristics of a data set.
Inferential Statistics: Uses data to make predictions or inferences about a population.
Step-by-Step Guidance
Identify whether the statement is summarizing past data or making a prediction about future events.
Recall that predictions are typically the domain of inferential statistics.
Try solving on your own before revealing the answer!
Q5. Classify the variable: The cost of a Statistics textbook.
Background
Topic: Types of Variables
This question tests your understanding of qualitative (categorical) vs. quantitative (numerical) variables.
Key Terms:
Qualitative Variable: Describes qualities or categories (non-numeric).
Quantitative Variable: Represents numeric values that can be measured or counted.
Step-by-Step Guidance
Ask yourself if the variable is a number that can be measured or counted, or if it describes a category or quality.
Consider whether you could perform arithmetic operations on the values (e.g., add, subtract).
Try solving on your own before revealing the answer!
Q6. Classify the variable: Eye Color.
Background
Topic: Types of Variables
This question tests your ability to distinguish between qualitative and quantitative variables.
Key Terms:
Qualitative Variable: Describes non-numeric categories or qualities.
Quantitative Variable: Numeric and measurable.
Step-by-Step Guidance
Determine if "eye color" is a number or a category.
Recall that qualitative variables describe attributes or categories.
Try solving on your own before revealing the answer!
Q7. What method of data collection is used in a study where a drug is given to one group and a placebo to another?
Background
Topic: Methods of Data Collection
This question tests your understanding of different ways to collect data: experiment, observational study, simulation, and survey.
Key Terms:
Experiment: Researchers apply a treatment and observe its effects.
Observational Study: Researchers observe without intervening.
Simulation: Use of models to replicate real-world processes.
Survey: Collecting data by asking questions.
Step-by-Step Guidance
Identify if the researchers are actively applying a treatment or just observing.
Recall that giving a drug or placebo is an intervention, which is a key feature of one method.
Try solving on your own before revealing the answer!
Q8. What method of data collection is used in a political poll?
Background
Topic: Methods of Data Collection
This question tests your ability to identify the correct method for collecting data in a polling context.
Key Terms:
Simulation: Using models to mimic real-world processes.
Observational Study: Observing outcomes without intervention.
Experiment: Applying treatments to observe effects.
Step-by-Step Guidance
Consider whether the pollster is manipulating any variables or just collecting opinions.
Recall that surveys and polls are typically a form of observational study or survey, not experiment or simulation.
Try solving on your own before revealing the answer!
Q9. Identify the sampling method: 50 sophomores, 30 juniors, and 20 seniors are randomly selected from their respective groups.
Background
Topic: Sampling Methods
This question tests your understanding of different sampling techniques: stratified, cluster, convenience, and systematic.
Key Terms:
Stratified Sampling: Dividing the population into groups (strata) and randomly sampling from each group.
Cluster Sampling: Randomly selecting entire groups (clusters).
Convenience Sampling: Using samples that are easy to obtain.
Systematic Sampling: Selecting every nth individual.
Step-by-Step Guidance
Notice that the population is divided into groups (sophomores, juniors, seniors).
Check if random samples are taken from each group or if entire groups are selected.
Try solving on your own before revealing the answer!
Q10. Identify the sampling method: Every fifth person boarding a plane is searched.
Background
Topic: Sampling Methods
This question tests your understanding of systematic, cluster, convenience, and random sampling.
Key Terms:
Systematic Sampling: Selecting every nth individual from a list or sequence.
Cluster Sampling: Selecting entire groups.
Convenience Sampling: Sampling those easiest to reach.
Random Sampling: Every individual has an equal chance of being selected.
Step-by-Step Guidance
Identify if there is a fixed interval for selection (e.g., every fifth person).
Recall which sampling method uses a regular pattern or interval.
Try solving on your own before revealing the answer!
Q11. Identify the sampling method: Five statistics classes are randomly selected, and all students in those classes are interviewed.
Background
Topic: Sampling Methods
This question tests your understanding of cluster, stratified, systematic, random, and convenience sampling.
Key Terms:
Cluster Sampling: Randomly selecting entire groups and including all members.
Stratified Sampling: Randomly selecting individuals from each group.
Step-by-Step Guidance
Notice that entire classes (groups) are selected, not individuals from each class.
Recall which method involves randomly selecting groups and including all members of those groups.
Try solving on your own before revealing the answer!
Q12. Identify the sampling method: A student interviews everyone in a statistics class.
Background
Topic: Sampling Methods
This question tests your understanding of convenience, cluster, random, stratified, and systematic sampling.
Key Terms:
Convenience Sampling: Using samples that are easiest to access.
Step-by-Step Guidance
Consider whether the sample was chosen for ease of access rather than randomness or structure.
Recall that interviewing everyone in a readily available group is a hallmark of one method.
Try solving on your own before revealing the answer!
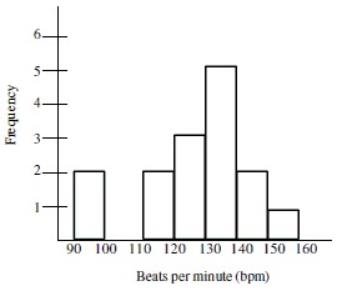
Q13. What percent of participants had a heart rate between 130 and 150 bpm?
Background
Topic: Interpreting Histograms
This question tests your ability to read and interpret data from a histogram.
Key Terms:
Histogram: A graphical representation of the distribution of numerical data.
Frequency: The number of observations within a given interval.
Step-by-Step Guidance
Identify the bars on the histogram that correspond to the 130–150 bpm range.
Count the frequencies for these bars.
Recall the total number of participants (15) and calculate the percentage for the specified range.
Try solving on your own before revealing the answer!
Q14. Find the mean score for the given heights.
Background
Topic: Measures of Central Tendency
This question tests your ability to calculate the mean (average) of a data set.
Key Formula:
= each value in the data set
= number of values
Step-by-Step Guidance
Add up all the heights: .
Count the number of values (there are 10).
Divide the sum by the number of values to find the mean.
Try solving on your own before revealing the answer!
Q15. Find the median score for the given heights.
Background
Topic: Measures of Central Tendency
This question tests your ability to find the median (middle value) of a data set.
Key Steps:
Order the data from least to greatest.
If the number of values is even, the median is the average of the two middle values.
Step-by-Step Guidance
Arrange the heights in ascending order.
Identify the two middle values (since there are 10 values).
Calculate the average of the two middle values to find the median.
Try solving on your own before revealing the answer!
Q16. Find the mode for the given heights.
Background
Topic: Measures of Central Tendency
This question tests your ability to identify the mode (most frequent value) in a data set.
Key Steps:
Mode is the value that appears most frequently in the data set.
Step-by-Step Guidance
Count how many times each height appears in the list.
Identify the height(s) that occur most frequently.
Try solving on your own before revealing the answer!
Q17. The median LSAT score is 170. Which statement is NOT correct?
Background
Topic: Interpreting the Median
This question tests your understanding of what the median represents in a data set.
Key Terms:
Median: The value that separates the higher half from the lower half of a data set.
Percentile: The value below which a given percentage of observations fall.
Step-by-Step Guidance
Recall that the median is the 50th percentile.
Review each statement and determine which one does NOT accurately describe the median.
Try solving on your own before revealing the answer!
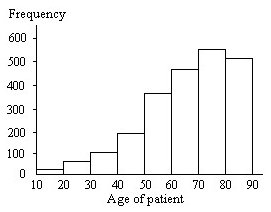
Q18. Identify the overall shape of the distribution and the better measure of center for the ages of osteoporosis patients.
Background
Topic: Distribution Shape and Measures of Center
This question tests your ability to interpret histograms and choose the appropriate measure of center (mean or median) based on skewness.
Key Terms:
Skewness: The direction in which a distribution tails off (left or right).
Mean vs. Median: The median is less affected by skewed data than the mean.
Step-by-Step Guidance
Examine the histogram to determine if the data is skewed left, right, or is symmetric/multimodal.
Recall that for skewed distributions, the median is usually a better measure of center.
Try solving on your own before revealing the answer!
Q19. Find the range of the data set for electric smooth top ranges.
Background
Topic: Measures of Spread
This question tests your ability to calculate the range of a data set.
Key Formula:
Step-by-Step Guidance
Identify the largest and smallest values in the data set.
Subtract the smallest value from the largest value to find the range.
Try solving on your own before revealing the answer!
Q20. Find the sample standard deviation for the given heights.
Background
Topic: Measures of Spread
This question tests your ability to calculate the sample standard deviation.
Key Formula:
= each value
= sample mean
= sample size
Step-by-Step Guidance
Calculate the mean of the data set.
Subtract the mean from each value and square the result for each value.
Add up all the squared differences.
Divide the sum by (degrees of freedom for a sample).
Take the square root of the result to find the standard deviation.
Try solving on your own before revealing the answer!
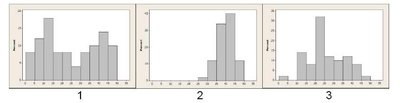
Q21. Which histogram summarizes the data set with the smallest standard deviation?
Background
Topic: Interpreting Standard Deviation from Graphs
This question tests your ability to visually compare the spread of data in histograms.
Key Terms:
Standard Deviation: A measure of how spread out the values in a data set are.
Step-by-Step Guidance
Look for the histogram where the data is most tightly clustered around the center.
Recall that a smaller spread means a smaller standard deviation.
Try solving on your own before revealing the answer!
Q22. What percentage of pregnancies are between 255 and 275 days (mean 265, SD 10) using the Empirical Rule?
Background
Topic: Empirical Rule (68-95-99.7 Rule)
This question tests your ability to apply the Empirical Rule to a normal distribution.
Key Formula:
Within 1 standard deviation: 68%
Within 2 standard deviations: 95%
Within 3 standard deviations: 99.7%
Step-by-Step Guidance
Calculate how many standard deviations 255 and 275 are from the mean (265).
Determine which Empirical Rule percentage applies to this range.
Try solving on your own before revealing the answer!
Q23. Determine the Five Number Summary for the given heights.
Background
Topic: Five Number Summary
This question tests your ability to identify the minimum, first quartile (Q1), median, third quartile (Q3), and maximum of a data set.
Key Terms:
Minimum: Smallest value
Q1: First quartile (25th percentile)
Median: Middle value
Q3: Third quartile (75th percentile)
Maximum: Largest value
Step-by-Step Guidance
Order the data from least to greatest.
Identify the minimum and maximum values.
Find the median, Q1, and Q3.
Try solving on your own before revealing the answer!
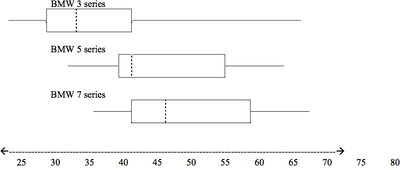
Q24. For which BMW series is the median age of purchase equal to 41?
Background
Topic: Interpreting Boxplots
This question tests your ability to read a boxplot and identify the median value for different groups.
Key Terms:
Boxplot: A graphical summary of the Five Number Summary.
Median: Shown as a line inside the box.
Step-by-Step Guidance
Locate the median line in each boxplot and match it to the value 41 on the scale.
Identify which BMW series corresponds to this median value.
Try solving on your own before revealing the answer!
Q25. Use z-scores to compare SAT and ACT performance.
Background
Topic: Standard Scores (z-scores)
This question tests your ability to calculate and interpret z-scores to compare scores from different distributions.
Key Formula:
= observed value
= mean
= standard deviation
Step-by-Step Guidance
Calculate the z-score for the SAT:
Calculate the z-score for the ACT:
Compare the two z-scores to determine which test the student performed better on relative to the mean.
Try solving on your own before revealing the answer!
