 Back
BackMore About Tests of Hypothesis: One-Proportion and One-Mean z-Tests
Study Guide - Smart Notes
 Tailored notes based on your materials, expanded with key definitions, examples, and context.
More About Tests of Hypothesis
Choosing the Hypotheses
Formulating hypotheses is a critical first step in hypothesis testing. The null hypothesis (H0) is chosen based on the context of the problem, not the data. It typically represents a statement of 'no effect' or 'no change.' The alternative hypothesis (Ha) is what the researcher aims to support.
Null Hypothesis (H0): A statement about a population parameter (e.g., mean, proportion) that indicates no effect or no difference.
Alternative Hypothesis (Ha): A statement that contradicts H0 and represents what the researcher wants to prove.
It is generally better to state your claim as the alternative hypothesis, since you cannot prove H0 true, only reject it.
Types of One-Proportion Hypothesis Tests
One-proportion z-tests are used to test hypotheses about population proportions. The form of the alternative hypothesis determines the type of test:
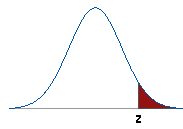
Upper-tailed test: H0: p = p0; Ha: p > p0
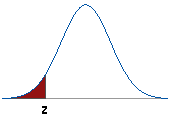
Lower-tailed test: H0: p = p0; Ha: p < p0
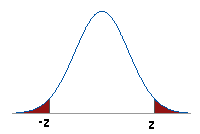
Two-tailed test: H0: p = p0; Ha: p ≠ p0
The test statistic is calculated as:
Where is the sample proportion, is the hypothesized proportion, and is the sample size.
P-value (upper-tailed): Area to the right of the test statistic.
P-value (lower-tailed): Area to the left of the test statistic.
P-value (two-tailed): Area in both tails beyond ±z.
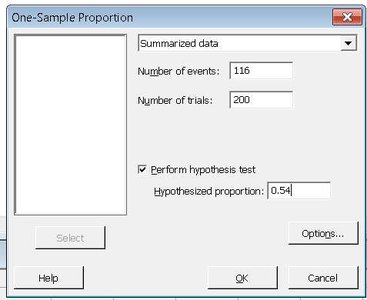
Example: Student Debt Hypothesis Test
Suppose in 2000, 54% of undergraduates graduated with debt. A recent survey of 200 graduates found 58% with debt. The hypotheses are:
H0: p = 0.54
Ha: p > 0.54
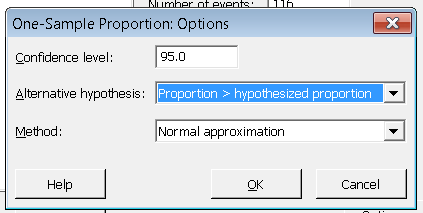
Test statistic:
P-value: P(z > 1.14) = 0.128
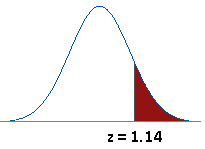
Since 0.128 > 0.05, we fail to reject H0. There is not enough evidence to conclude the proportion has increased.
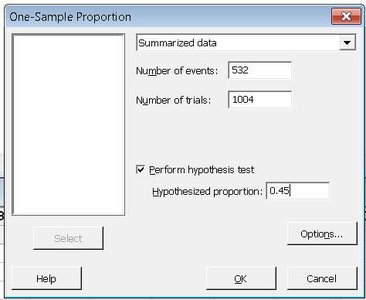
Example: Global Warming Belief Test
In a survey, 45% of Americans and 53% of 1,004 Canadians believe global warming is a fact. The hypotheses are:
H0: p = 0.45
Ha: p ≠ 0.45
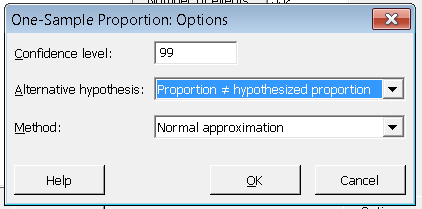
Test statistic:
P-value: 2 × P(z > 5.09) ≈ 0.000000358
Since the p-value is much less than 0.01, we reject H0. The proportion of Canadians who believe global warming is a fact is significantly different from Americans.
Interpreting P-values
The P-value is the probability of observing a statistic as extreme as, or more extreme than, the observed value, assuming the null hypothesis is true. It is not the probability that the null hypothesis is true.
A small P-value indicates strong evidence against H0.
A large P-value indicates insufficient evidence to reject H0.
Alpha Levels and Statistical Significance
The alpha level (α) is the threshold for statistical significance, commonly set at 0.10, 0.05, or 0.01. If the P-value ≤ α, we reject H0 and say the result is statistically significant at the α level.
α is also called the level of significance.
(1 – α) is the level of confidence.
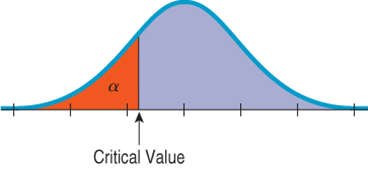
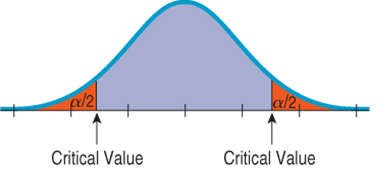
Critical Values and Rejection Regions
Critical values are z-scores that correspond to the chosen α level. For one-sided tests, all of α is in one tail; for two-sided tests, α is split between both tails.
Level of significance, α | Confidence level | One-sided z* | Two-sided z* |
|---|---|---|---|
0.10 | 90% | 1.282 | 1.645 |
0.05 | 95% | 1.645 | 1.96 |
0.01 | 99% | 2.33 | 2.576 |
0.001 | 99.9% | 3.09 | 3.29 |
Confidence Intervals and Hypothesis Tests
Confidence intervals and hypothesis tests are closely related. For two-sided tests, a (1 – α)100% confidence interval corresponds to a two-sided test at significance level α. If the null value is outside the interval, H0 is rejected.
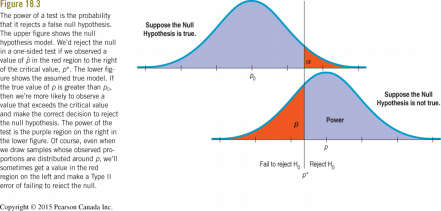
Decision Errors in Hypothesis Testing
There are two types of errors in hypothesis testing:
Type I Error (α): Rejecting H0 when it is true.
Type II Error (β): Failing to reject H0 when it is false.
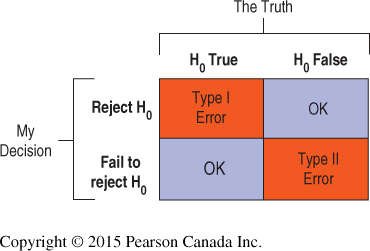
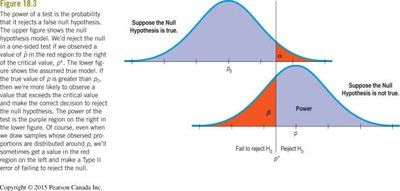
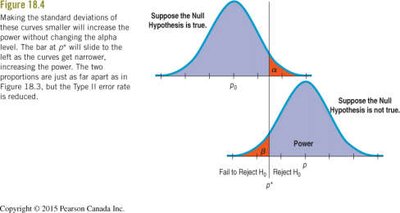
The probability of a Type I error is α, and the probability of a Type II error is β. The power of a test is 1 – β, the probability of correctly rejecting a false null hypothesis.
Power and Sample Size
The power of a test increases with larger sample sizes and larger effect sizes. Increasing the sample size narrows the sampling distribution, reducing both α and β.

One-Sample z-Test for Population Means
When testing hypotheses about a population mean (μ) with known population standard deviation (σ), the one-sample z-test is used. The hypotheses are:
H0: μ = μ0
Ha: μ ≠ μ0, μ > μ0, or μ < μ0
The test statistic is:
If σ is unknown and n ≥ 60, use the sample standard deviation s:
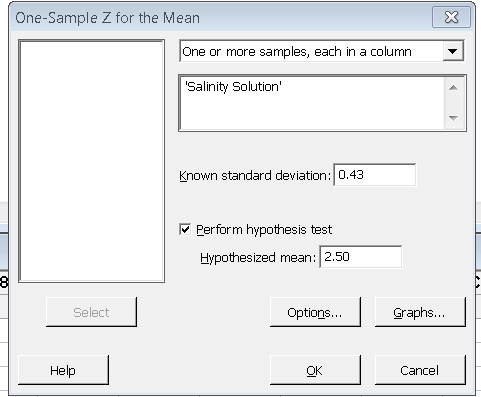
Example: Salinity of Canned Shrimp
Suppose the target salinity is 2.5 ppt, σ = 0.43 ppt, n = 57, and sample mean is 2.6035 ppt. Test at α = 0.05:
H0: μ = 2.5
Ha: μ ≠ 2.5
Test statistic:
P-value: 2 × P(z > 1.82) = 0.06876
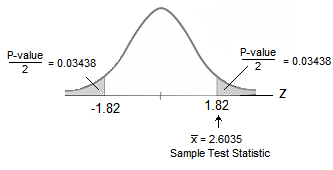
Since 0.06876 > 0.05, we fail to reject H0. The mean salinity is not significantly different from 2.5 ppt.
Summary Table: Decision Errors
H0 True | H0 False | |
|---|---|---|
Reject H0 | Type I Error (α) | Correct Decision (Power) |
Fail to Reject H0 | Correct Decision | Type II Error (β) |
What Can Go Wrong?
Do not interpret the P-value as the probability that H0 is true.
Do not confuse statistical significance with practical importance.
Be aware of the risks of Type I and Type II errors.
Report both P-values and confidence intervals for comprehensive results.
Checklist for Hypothesis Testing
State the hypotheses (H0 and Ha).
Check assumptions (randomness, independence, sample size, normality if required).
Calculate the test statistic.
Find the P-value and compare to α.
State your conclusion in context.
