 Back
BackNormal Distribution and Probability Guidance for Chapter 6
Study Guide - Smart Notes
 Tailored notes based on your materials, expanded with key definitions, examples, and context.
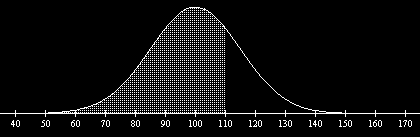
Q8. Find the area of the shaded region. The graph depicts IQ scores of adults, and those scores are normally distributed with a mean of 100 and a standard deviation of 15 (as on the Wechsler test).
Background
Topic: Normal Distribution, Probability as Area Under the Curve
This question tests your ability to interpret a normal distribution graph and calculate the probability (area) for a specified region, given the mean and standard deviation.
Key Terms and Formulas:
Normal Distribution: A symmetric, bell-shaped curve describing the spread of a variable.
Mean (): The center of the distribution (here, ).
Standard Deviation (): Measures spread (here, ).
Z-score:
Area under the curve: Represents probability for a range of values.
Step-by-Step Guidance
Identify the mean () and standard deviation () from the problem statement.
Examine the graph to determine the range of IQ scores corresponding to the shaded region. (Is it above or below a certain value?)
Convert the relevant IQ score(s) to z-scores using .
Use the z-score to find the area under the normal curve (probability) for the shaded region, either from a z-table or using technology.
Try solving on your own before revealing the answer!
Final Answer: 0.7486
The area of the shaded region is approximately 0.7486, meaning about 74.86% of adults have IQ scores in the shaded range.
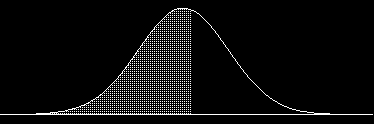
Q9. Find the indicated IQ score. The graph depicts IQ scores of adults, and those scores are normally distributed with a mean of 100 and a standard deviation of 15 (as on the Wechsler test). The shaded area under the curve is 0.5675.
Background
Topic: Normal Distribution, Finding a Value Given a Probability
This question tests your ability to use the normal distribution to find the IQ score corresponding to a given cumulative probability (area under the curve).
Key Terms and Formulas:
Percentile: The value below which a given percentage of observations fall.
Z-score:
Inverse Normal Calculation: Find for a given area, then solve for .
Step-by-Step Guidance
Identify the mean () and standard deviation ().
Recognize that the shaded area (0.5675) represents the cumulative probability to the left of the unknown IQ score.
Use a z-table or technology to find the z-score corresponding to a cumulative probability of 0.5675.
Once you have the z-score, use the formula to find the corresponding IQ score.
Try solving on your own before revealing the answer!
Final Answer: 102.6
The IQ score corresponding to the cumulative area of 0.5675 is approximately 102.6.
