 Back
5.3
Study Guide - Smart Notes
 Tailored notes based on your materials, expanded with key definitions, examples, and context.
Normal Probability Distributions
Finding Values Given a Probability
This section focuses on the process of determining the value of a random variable x in a normal distribution when a probability or percentile is given. This is the reverse of finding probabilities for a given value, as covered in earlier sections.
Process Overview: Given a probability (area), find the corresponding z-score, then use the z-score to find the x-value.
Standard Normal Table: Use the z-table (Table 4) to locate areas and z-scores. The z-scores are found on the margins, while the area/probability is inside the table.
Decimal Precision: Probabilities/areas should be written to four decimal places to avoid confusion with z-scores.
Finding a z-score Given a Percentile
To find the z-score associated with a given percentile, follow these steps:
Convert the percentage to a decimal (e.g., 55% → 0.5500).
Locate the two consecutive areas in the z-table that the desired area falls between.
Choose the z-score associated with the area closest to the desired value. If the desired area is exactly between two table values, average the corresponding z-scores.
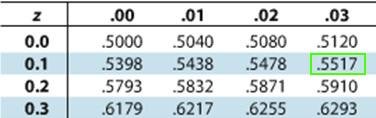
Example: Find the z-score associated with P55 (55%). P55 = 0.5500. The closest table values are 0.5478 and 0.5517. 0.5517 is closer, so the z-score is 0.13.
Example: Find the z-score associated with P5 (5%). P5 = 0.0500. The closest table values are 0.0495 (z = -1.65) and 0.0505 (z = -1.64). Since 0.0500 is exactly between them, average the z-scores: .
Important Notes on Averaging z-scores
Only average z-scores when the desired area is exactly between two table values.
Otherwise, use the z-score for the area closest to the desired value.
Finding z-scores for Areas to the Left or Right
When the area is to the left, use the value directly from the table. For areas to the right, find the complement (1 - area) and then use the table.
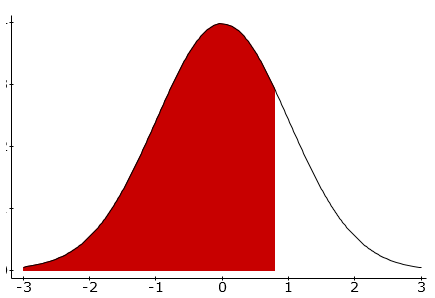
Example: Find the z-score with 78.5% of the area to its left. Area = 0.7850. Closest table values: 0.7823 and 0.7852. 0.7852 is closer, so z = 0.79.
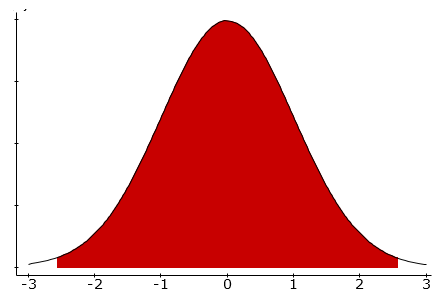
Example: Find the z-score for which 99% of the distribution's area lies between -z and z. Area in the center = 0.9900. Area in both tails = 1 - 0.9900 = 0.0100. Area in one tail = 0.0100 / 2 = 0.0050. Closest table values: 0.0049 (z = -2.58) and 0.0051 (z = -2.57). Average: . Final answer: z = ±2.575.
Transforming a z-score to an x-value
To convert a z-score to a data value x in a population, use the formula:
Where: = population mean, = population standard deviation
Example: In a survey of men (ages 20–29), mean height inches, inches. What height represents the 90th percentile?
90th percentile = 0.9000. Closest area: 0.8997 (z = 1.28).
Calculate x: inches.
Practice Problems and Solutions
Find the z-score associated with P15: P15 = 0.1500. Closest area: 0.1492 (z = -1.04).
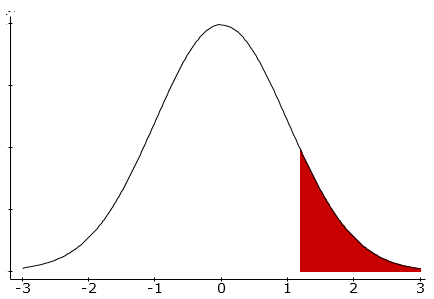
Find the z-score with 11.9% of the area to its right: Area to the right = 0.1190. Complement = 1 - 0.1190 = 0.8810. Table value: 0.8810 (z = 1.18).
Find the height representing the first quartile: First quartile = 0.2500. Closest area: 0.2514 (z = -0.67). inches.
Find the shortest time spent sleeping in the top 5%: Top 5% = area to the right = 0.0500. Complement = 0.9500. Closest areas: 0.9495 (z = 1.64), 0.9505 (z = 1.65). Average: . hours.
Summary Table: Steps for Finding Values in Normal Distributions
Step | Description |
|---|---|
1 | Convert percentage to decimal (4 places) |
2 | Locate closest area(s) in z-table |
3 | Find associated z-score (average if exactly between) |
4 | Use formula to find x-value |
Additional info: The notes reinforce the importance of careful use of the z-table, precision in decimal places, and the distinction between areas to the left and right. The examples provided cover percentiles, quartiles, and tail probabilities, which are fundamental for understanding normal distributions in introductory statistics.
