 Back
Normal Probability Distributions and the Central Limit Theorem: Study Notes
Study Guide - Smart Notes
 Tailored notes based on your materials, expanded with key definitions, examples, and context.
Normal Probability Distributions
Introduction to Normal Distributions
The normal distribution is a fundamental concept in statistics, describing a continuous probability distribution for a random variable, x. Its graph, known as the normal curve, is bell-shaped and symmetric about the mean (μ). The total area under the curve is always 1, representing the entire probability space.
Mean (μ) and Standard Deviation (σ): A normal distribution can have any mean and any positive standard deviation.
Shape: Large standard deviation produces a 'fat' curve, while a small standard deviation produces a 'skinny' curve.
The Standard Normal Distribution
The standard normal distribution is a special case of the normal distribution with a mean of 0 and a standard deviation of 1. The variable z represents the number of standard deviations a value is from the mean.
Properties: The area under the curve to the left of z = 0 is 0.5. Areas to the left of extreme z-scores (e.g., z = -3.49 or z = 3.49) are close to 0 or 1, respectively.
Finding Area Under a Normal Curve
To find the cumulative area (probability) to the left, right, or between z-scores, use the Standard Normal Table or a calculator. The area represents the probability that a randomly selected value falls within a specified range.
To the left of z: Find the area directly from the table.
To the right of z: Subtract the area to the left from 1.
Between two z-scores: Subtract the area to the left of the lower z-score from the area to the left of the higher z-score.
Example: Using The Standard Normal Table
Find the cumulative area that corresponds to a z-score of 1.15. The area to the left of z = 1.15 is 0.8749.
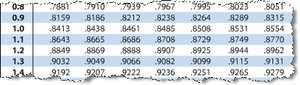
Example: Finding Area Under the Standard Normal Curve
Area to the left of z = -0.24 is 0.4052.
Area to the left of z = -0.99 is 0.1611.
Area to the right of z = 1.06 is 1 - 0.8554 = 0.1446.
Area between z = -1.50 and z = 1.25 is 0.8944 - 0.0668 = 0.8276.
Normal Distributions: Finding Probabilities
Probability and Normal Distributions
If a random variable x is normally distributed, the probability that x falls within an interval is equal to the area under the normal curve for that interval. To solve these problems, convert x to a z-score using:
Then use the standard normal table to find the corresponding area.
Example: Cellular Phone Usage
Mean usage: 1.5 years, standard deviation: 0.25 years.
Probability user keeps phone less than 1 year: ; area to left of z = -2 is 0.0228.
Probability user keeps phone more than 1.75 years: ; area to right of z = 1 is 1 - 0.8413 = 0.1587.
Probability user keeps phone between 1 and 1.75 years: area between z = -2 and z = 1 is 0.8413 - 0.0228 = 0.8185.
Example: Supermarket Shopping Time
Mean: 45 minutes, standard deviation: 12 minutes.
Probability shopper is in store between 24 and 54 minutes: , ; area between z = -1.75 and z = 0.75 is 0.7734 - 0.0401 = 0.7333.
Probability shopper is in store more than 39 minutes: ; area to right of z = -0.5 is 1 - 0.3085 = 0.6915.
If 200 shoppers enter, expected number in store more than 39 minutes: 200 × 0.6915 ≈ 138 shoppers.
Normal Distributions: Finding Values
Finding Values Given a Probability
Percentiles are data values that split the distribution into 100 equal parts. The nth percentile is the value below which n% of the data falls.
To find the value corresponding to a given percentile, first find the z-score for the desired cumulative area, then transform it to an x-value using:
Example: Weights of Dogs
Mean: 9 pounds, standard deviation: 2 pounds.
z = 1.96 (97.5th percentile): pounds.
z = 0 (50th percentile): pounds.
z = -0.44 (33rd percentile): pounds.
Example: Job Exam Scores
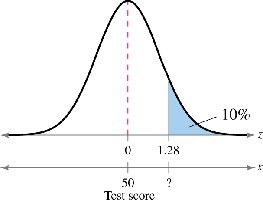
Scores are normally distributed with mean 50 and standard deviation 10. To be hired, applicants must score in the top 10% (above the 90th percentile).
Find z-score for cumulative area 0.9: z ≈ 1.28.
Transform to x-value:
Minimum score to be hired is about 63.
Sampling Distributions and the Central Limit Theorem
Sampling Distribution of Sample Means
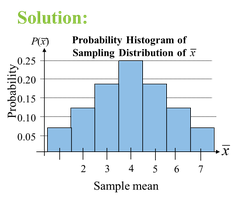
A sampling distribution is the probability distribution of a sample statistic (such as the sample mean) formed when random samples of size n are repeatedly taken from a population.
The mean of the sampling distribution of sample means is equal to the population mean (μ).
The standard deviation of the sampling distribution (called the standard error) is .
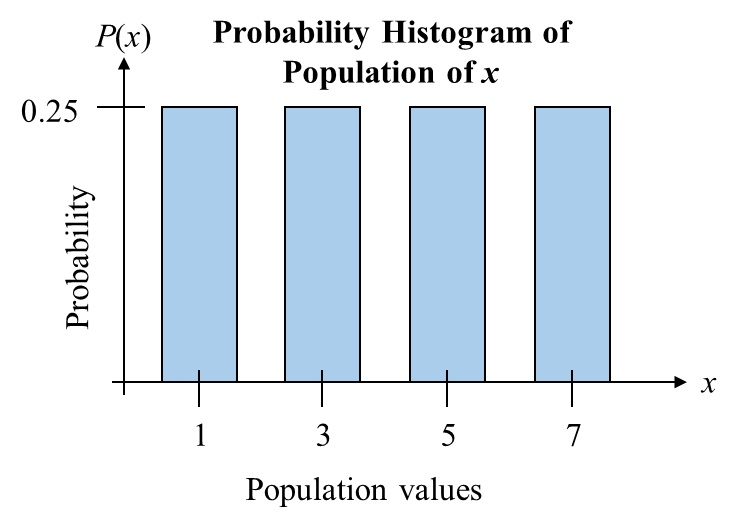
Example: Probability Histogram of Population
Example: Probability Distribution for Sample Means
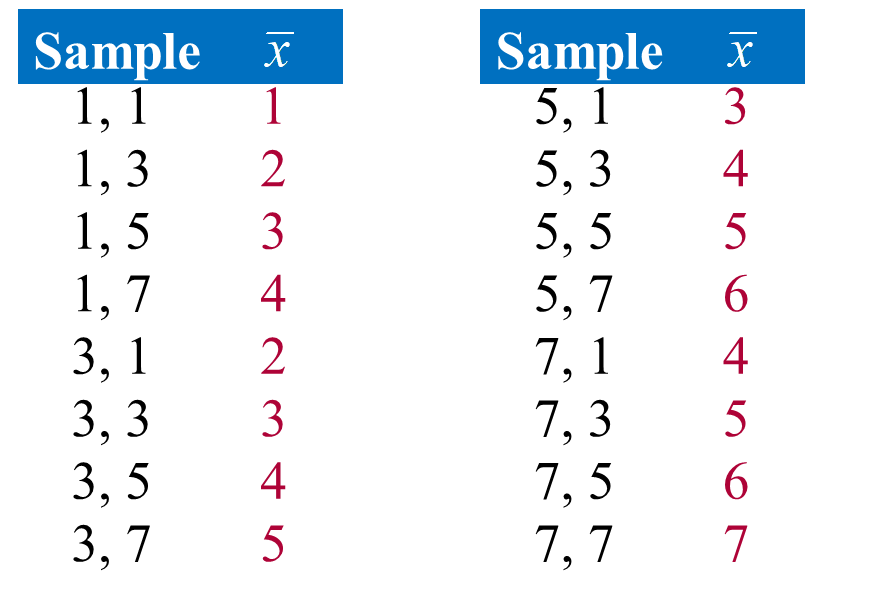
Solution: Probability Histogram of Sampling Distribution
The Central Limit Theorem (CLT)
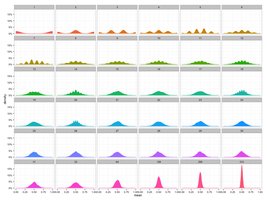
The Central Limit Theorem states that, for any population with mean μ and standard deviation σ, the sampling distribution of the sample mean approaches a normal distribution as the sample size n increases (typically n ≥ 30 is considered sufficient). This holds true regardless of the shape of the original population distribution.
For large n, the distribution of sample means is approximately normal.
Mean of sample means: μ
Standard error:
Central Limit Theorem Example 1
Cellular phone bills: mean $63, standard deviation $11.
Sample size n = 36: mean of sample means = \frac{11}{\sqrt{36}} = 1.83 $.
Probability that average bill is between $60 and $64: Convert to z-scores and use standard normal table.
Central Limit Theorem Example 2
Credit card debts: mean $3173, standard deviation $1120.
Probability that a randomly selected undergraduate has a balance less than $2700: Convert to z-score and use standard normal table.
For samples of n = 25 or n = 49, use the standard error to find probability for sample means.
Summary Table: Properties of Normal and Sampling Distributions
Distribution | Mean | Standard Deviation | Shape |
|---|---|---|---|
Normal | μ | σ | Bell-shaped, symmetric |
Standard Normal | 0 | 1 | Bell-shaped, symmetric |
Sampling Distribution of Means | μ | Approximately normal for n ≥ 30 |
Additional info: The notes above expand on brief points with academic context, definitions, and examples to ensure completeness and clarity for introductory statistics students.
