 Back
BackNormal Probability Distributions: Study Notes
Study Guide - Smart Notes
 Tailored notes based on your materials, expanded with key definitions, examples, and context.
Normal Probability Distributions
Introduction to Continuous Random Variables
Continuous random variables (CRVs) can take any value within a given range and are not restricted to isolated points, unlike discrete random variables. Probabilities for CRVs are determined by calculating the area under a probability density function (PDF) over a specified interval.
Discrete Random Variable: Can only take specific, separate values (e.g., number of die rolls).
Continuous Random Variable: Can take any value within an interval (e.g., time, distance).
Probability for CRV: is the area under the PDF from to .
Example: For a die roll (discrete), . For a continuous variable, probability is found by integrating the PDF over the interval.
Uniform Distribution
The uniform distribution is a type of continuous probability distribution where every value within a certain interval is equally likely. The PDF is constant over the interval.
Probability Density Function: for
Total Area: The total area under the PDF is always 1.
Probability Calculation:
Example: If response time is uniformly distributed between 2 and 12 seconds, the probability that a call is answered in 5-9 seconds is .
Probability Density Functions (PDFs)
A valid PDF must satisfy two conditions: (1) for all , and (2) the total area under the curve is 1. Probabilities are found by calculating the area under the curve for the desired interval.
Check for Valid PDF: Integrate over its domain; result must be 1.
Probability:
Standard Normal Distribution
The standard normal distribution is a normal distribution with mean and standard deviation . Probabilities are found using the standard normal (z) table, which gives cumulative probabilities from the left up to a given z-score.
Z-Score:
Finding Probabilities: Use the z-table to find or .
Area to the Right:
Area Between Two Z-Scores:
Example: (from z-table), .

Finding Z-Scores from Probabilities
To find the z-score corresponding to a given probability (area), use the z-table in reverse. If the area is to the right, subtract from 1 to get the area to the left, then look up the z-score.
Given Area to Left: Find z such that .
Given Area to Right: Find z such that ; use .
Example: If , z-score is approximately 0.34 (from z-table).
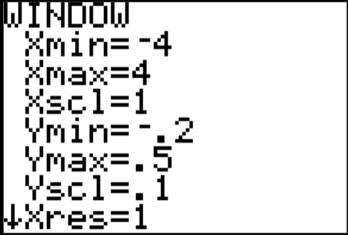
Using the TI-84 Calculator for Normal Probabilities
The TI-84 calculator can quickly compute probabilities and z-scores for normal distributions using built-in functions.
Finding Probability from Z-Score: Use normalcdf or ShadeNorm functions.
Finding Z-Score from Probability: Use invNorm function.
Standard Normal Parameters: ,

Non-Standard Normal Distributions
For normal distributions with mean or standard deviation , convert values to z-scores before using the standard normal table or calculator.
Z-Score Formula:
Finding Probabilities: Convert to , then use the z-table or calculator.
Example: Commute times are normal with , . Probability of less than 10 minutes: , .
Finding Values from Probabilities (Non-Standard Normal)
To find the value corresponding to a given probability, first find the z-score from the probability, then solve for $x$ using the mean and standard deviation.
Value from Probability:
Example: Heights of women are normal with cm, cm. Find such that 5% are shorter than $x$: , cm.
Summary Table: Key Formulas and Functions
Concept | Formula/Function | Description |
|---|---|---|
Uniform PDF | For | |
Probability (Uniform) | Area under PDF | |
Z-Score | Standardizes value | |
Probability (Standard Normal) | z-table, calculator | Find area under curve |
Value from Probability | Reverse standardization |
Additional info: These notes cover the essentials of continuous random variables, the uniform and normal distributions, and practical calculation methods using tables and calculators, as outlined in a typical college statistics course (Ch. 6 - Normal Probability Distributions).
