 Back
BackNumerical Measures of Central Tendency in Statistics
Study Guide - Smart Notes
 Tailored notes based on your materials, expanded with key definitions, examples, and context.
Numerical Measures of Central Tendency
Introduction to Central Tendency
Central tendency refers to the statistical measures that identify a single value as representative of an entire data set. These measures help summarize and describe the main features of a collection of quantitative data, whether from a sample or a population. The three primary measures of central tendency are the mean, median, and mode.
Mean
The mean is the arithmetic average of a set of quantitative measurements. It is calculated by summing all the measurements and dividing by the number of measurements. The mean is widely used in statistical inference to estimate population parameters based on sample data.
Sample Mean (\( \bar{x} \)): The mean of a sample, denoted as \( \bar{x} \).
Population Mean (\( \mu \)): The mean of a population, denoted as \( \mu \).
Formula:
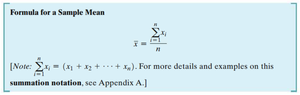
Example: For the sample measurements 5, 3, 8, 5, 6, the mean is \( \bar{x} = \frac{5+3+8+5+6}{5} = 5.4 \).
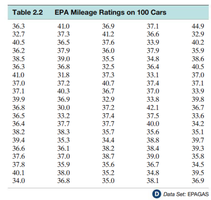
Application: The mean of EPA mileage ratings for 100 cars can be calculated using the formula above.
Additional info: The sample mean is often used to estimate the population mean when the entire population data is unavailable. The reliability of this estimate depends on the sample size and variability.
Median
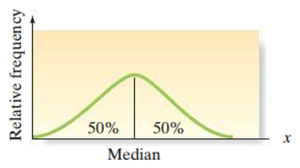
The median is the middle value in a data set when the measurements are arranged in ascending or descending order. It divides the data into two equal halves, with 50% of the values below and 50% above the median. The median is less sensitive to extreme values than the mean, making it a better measure of central tendency for skewed distributions.
Sample Median (M): The median of a sample.
Population Median (\( \eta \)): The median of a population.
Calculation Steps:
Arrange the data in order.
If the number of measurements (n) is odd, the median is the middle value.
If n is even, the median is the mean of the two middle values.
Example: For the sample 5, 7, 4, 5, 20, 6, 2 (n=7), arrange as 2, 4, 5, 5, 6, 7, 20. The median is 5.
Additional info: The median is preferred over the mean in cases where the data set contains outliers or is highly skewed, such as household income data.
Mode
The mode is the value that occurs most frequently in a data set. It indicates the point of highest concentration of data and is useful for categorical as well as quantitative data.
Example: For the ratings 8, 7, 9, 6, 8, 10, 9, 9, 5, 7, the mode is 9, as it appears most frequently.
Additional info: A data set may have no mode, one mode (unimodal), or more than one mode (bimodal or multimodal).
Comparing Mean and Median: Detecting Skewness
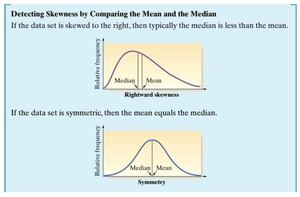
Skewness describes the asymmetry of a data distribution. Comparing the mean and median provides a method for detecting skewness:
Rightward Skewness: The mean is greater than the median. The right tail contains more extreme values.
Leftward Skewness: The mean is less than the median. The left tail contains more extreme values.
Symmetric Distribution: The mean equals the median.
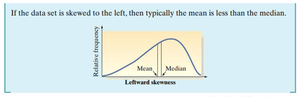
Additional info: Skewness affects the choice of central tendency measure. For highly skewed data, the median is often preferred over the mean.
Summary Table: Measures of Central Tendency
Measure | Symbol (Sample) | Symbol (Population) | Definition | Sensitivity to Outliers |
|---|---|---|---|---|
Mean | \( \bar{x} \) | \( \mu \) | Arithmetic average | High |
Median | M | \( \eta \) | Middle value | Low |
Mode | Mode | Mode | Most frequent value | Low |
