 Back
BackNumerical Measures of Variability in Statistics
Study Guide - Smart Notes
 Tailored notes based on your materials, expanded with key definitions, examples, and context.
Numerical Measures of Variability
Introduction to Variability
Measures of central tendency, such as the mean, median, and mode, provide only a partial description of a quantitative data set. To fully understand a data set, it is essential to also consider its variability, which describes the spread or dispersion of the data. Knowledge of both the center and variability helps visualize the shape of the data and identify extreme values.
Importance of Variability
Consider comparing response times to a stimulus for subjects treated with two different drugs, A and B. Both data sets may have the same mean, median, and mode, but their variability can differ significantly. Drug A's response times are spread out, while Drug B's are clustered around the center, indicating less variability for Drug B.
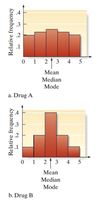
Key Point: Measures of central tendency alone cannot distinguish between data sets with different spreads.
Example: Two distributions with identical means but different variability.
Range as a Measure of Variability
Definition and Limitations
The range is the simplest measure of variability, calculated as the difference between the largest and smallest measurements in a data set. While easy to compute and understand, the range is insensitive to the overall distribution, especially in large data sets, and may not detect differences in variation.
Formula:
Limitation: Two data sets can have the same range but very different variability.
Deviations from the Mean
Understanding Deviations
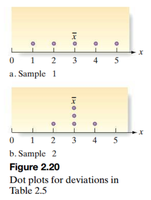
To better measure variability, we examine the deviation of each measurement from the mean. Large deviations indicate a spread-out data set, while small deviations suggest clustering around the mean.
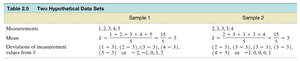
Key Point: The magnitude of deviations reflects the degree of variability.
Example: Sample 1 has larger deviations than Sample 2, indicating greater variability.
Sample Variance
Definition and Calculation
The sample variance condenses the information in deviations into a single numerical measure. It is calculated by squaring each deviation (to eliminate negatives), summing them, and dividing by (n - 1), where n is the sample size. The symbol represents sample variance.
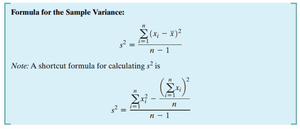
Formula:
Shortcut Formula:
Worked Example: Sample Variance
Given the sample: 1, 2, 3, 4, 5
Step 1: Find the mean:
Step 2: Calculate squared deviations and sum:
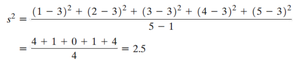
Result:
Sample Standard Deviation
Definition and Calculation
The sample standard deviation, denoted by , is the positive square root of the sample variance. It provides a measure of variability in the same units as the original data.
Formula:
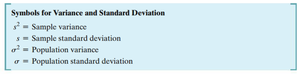
Symbols:
= Sample variance
= Sample standard deviation
= Population variance
= Population standard deviation
Worked Example: Standard Deviation
Calculate the variance and standard deviation for the sample: 2, 3, 3, 3, 4
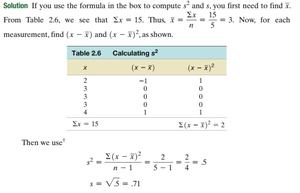
Step 1: Find the mean:
Step 2: Calculate squared deviations and sum:
Step 3: Compute variance:
Step 4: Compute standard deviation:
Summary Table: Symbols for Variance and Standard Deviation
Symbol | Description |
|---|---|
s2 | Sample variance |
s | Sample standard deviation |
σ2 | Population variance |
σ | Population standard deviation |
Conclusion
Measures of variability, such as range, variance, and standard deviation, are essential for describing the spread of a data set. They complement measures of central tendency and provide a fuller understanding of the data's distribution and potential outliers.
