 Back
Numerically Summarizing Data: Measures of Central Tendency
Study Guide - Smart Notes
 Tailored notes based on your materials, expanded with key definitions, examples, and context.
Chapter 3: Numerically Summarizing Data
Measures of Central Tendency
Measures of central tendency are statistical values that represent a typical or central entry of a data set. The most common measures are the mean, median, and mode. These measures help summarize and describe the center of a data distribution, providing insight into the data's overall pattern.
Mean: The arithmetic average of all data entries.
Median: The middle value when the data set is ordered.
Mode: The value(s) that occur most frequently in the data set.
Mean
The mean is calculated by summing all data entries and dividing by the number of entries. It is a reliable measure because it incorporates every value in the data set, but it is sensitive to outliers.
Population Mean Formula:
Sample Mean Formula:
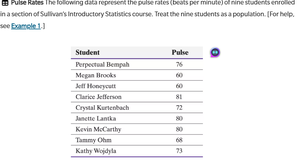
Example: Consider the following pulse rates for nine students:
Student | Pulse |
|---|---|
Perpetual Bempah | 76 |
Megan Brooks | 60 |
Jeff Honeycutt | 60 |
Clarice Jefferson | 81 |
Crystal Kurtenbach | 72 |
Janette Lantka | 80 |
Kevin McCarthy | 80 |
Tammy Ohm | 68 |
Kathy Wojdyla | 73 |
To find the mean pulse rate, sum all values and divide by 9.
Median
The median is the value that lies in the middle of the data when the data set is ordered. It divides the data into two equal parts and is resistant to outliers.
If the data set has an odd number of entries, the median is the middle entry.
If the data set has an even number of entries, the median is the mean of the two middle entries.
Example: Find the median for the following scores:
Student | Score |
|---|---|
Michelle | 82 |
Ryanne | 77 |
Bilal | 90 |
Pam | 71 |
Jennifer | 62 |
Dave | 68 |
Joel | 74 |
Sam | 84 |
Justine | 94 |
Juan | 88 |
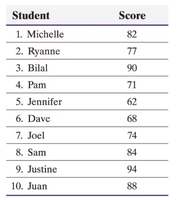
Order the scores and find the middle value (or average the two middle values if even).
Mode
The mode is the data entry that occurs with the greatest frequency. A data set may have no mode, one mode, or multiple modes (bimodal or multimodal). The mode is the only measure of central tendency that can be determined for qualitative (nominal) data.
Example: Find the mode for the following pulse rates:
Student | Pulse |
|---|---|
Perpetual Bempah | 76 |
Megan Brooks | 60 |
Jeff Honeycutt | 60 |
Clarice Jefferson | 81 |
Crystal Kurtenbach | 72 |
Janette Lantka | 80 |
Kevin McCarthy | 80 |
Tammy Ohm | 68 |
Kathy Wojdyla | 73 |
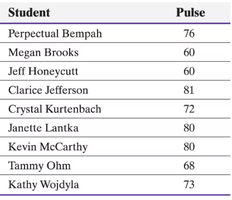
Here, both 60 and 80 appear twice, so the data set is bimodal.
Example: Find the mode for the following political views:
Liberal | Conservative | Moderate |
|---|---|---|
Moderate | Liberal | Moderate |
Liberal | Moderate | Conservative |
Moderate | Conservative | Moderate |
Moderate | Moderate | Liberal |
Liberal | Moderate | Liberal |
Conservative | Moderate | Moderate |
Liberal | Conservative | Liberal |
Liberal | Conservative | Conservative |
Conservative | Moderate | Conservative |
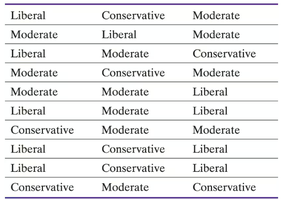
Count the frequency of each category to determine the mode.
Shape of the Distribution
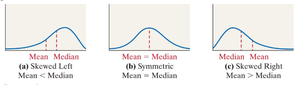
The shape of a data distribution affects which measure of central tendency is most appropriate. Distributions can be symmetric, skewed left, or skewed right. The mean, median, and mode may differ depending on the distribution's shape.
Symmetric Distribution: Mean = Median = Mode
Skewed Left: Mean < Median
Skewed Right: Mean > Median
Comparing the Mean, Median, and Mode
All three measures describe a typical entry of a data set, but each has advantages and disadvantages:
Mean: Uses all data values; not resistant to outliers.
Median: Resistant to outliers; best for skewed distributions.
Mode: Useful for categorical data; may not exist or may be multiple.
Guidelines:
Use the mean for symmetric distributions.
Use the median for skewed distributions.
Application: Disney Wait Times
The following data represent the wait times (in minutes) for a random sample of 40 visitors to Disney's Dinosaur Ride. The distribution is right-skewed, with the mean pulled to the right by outliers. The median is a better measure of central tendency for this data set.
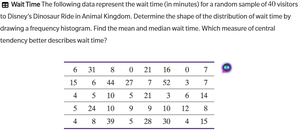
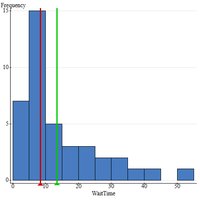
In right-skewed distributions, the mean is influenced by extreme values, while the median remains resistant.
Application: NFL Salaries
In the NFL, a few players earn extremely high salaries, which skews the distribution. The mean salary ($838,000) is much lower than the median ($1.87 million) due to these outliers. Owners may prefer the mean as it lowers the apparent average, while players may prefer the median as it better represents the typical salary.
Summary Table: Comparison of Central Tendency Measures
Measure | Definition | Best Used For | Resistant to Outliers? |
|---|---|---|---|
Mean | Arithmetic average | Symmetric distributions | No |
Median | Middle value | Skewed distributions | Yes |
Mode | Most frequent value | Categorical/nominal data | Yes |
