 Back
Numerically Summarizing Data: Measures of Central Tendency, Dispersion, and Position
Study Guide - Smart Notes
 Tailored notes based on your materials, expanded with key definitions, examples, and context.
Numerically Summarizing Data
Overview
Numerical summaries are essential for understanding the characteristics of a data distribution. The three primary characteristics are shape, center, and spread. Once these are known, analysts can identify features such as outliers and make informed decisions based on the data.
Measures of Central Tendency
Mean, Median, and Mode
Measures of central tendency describe the average or typical value in a data set. The three most common measures are the mean, median, and mode. Each provides a different perspective on the data's center and may yield different results depending on the distribution's shape.
Mean: The arithmetic mean is calculated by summing all values and dividing by the number of observations. It is sensitive to extreme values.
Median: The median is the middle value when data are arranged in ascending order. It is resistant to outliers.
Mode: The mode is the most frequently occurring value in the data set. Data can have no mode, one mode, or multiple modes (bimodal or multimodal).
Example: The mean and median of exam scores or song lengths can be calculated using the formulas below.
Population Mean:
Sample Mean:


Mean as Center of Gravity
The mean can be visualized as the center of gravity of a histogram, where the distribution balances perfectly at the mean value.

Finding the Median
To find the median:
Arrange the data in ascending order.
Determine the number of observations, n.
If n is odd, the median is the middle value. If n is even, the median is the mean of the two middle values.
Example: Median calculation for odd and even n.
Comparing Mean and Median
When data are skewed or contain outliers, the median is often a better measure of central tendency than the mean.


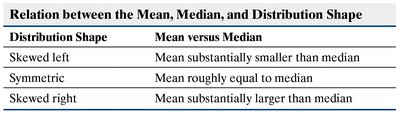
Relation Between Mean, Median, and Distribution Shape
The relationship between mean and median helps describe the shape of the distribution:
Skewed left: Mean < Median
Symmetric: Mean ≈ Median
Skewed right: Mean > Median

Mode
The mode is the most frequent value in a data set. It is useful for both quantitative and qualitative data.



Summary Table: Measures of Central Tendency
Measure | Computation | Interpretation | When to Use |
|---|---|---|---|
Mean | Population: Sample: | Center of gravity | Symmetric distributions |
Median | Middle value in ordered data | Divides bottom 50% from top 50% | Skewed distributions |
Mode | Most frequent value | Most frequent observation | Qualitative or when mode is desired |

Measures of Dispersion
Range
The range is the difference between the largest and smallest values in a data set.
Formula:
Standard Deviation and Variance
The standard deviation measures the typical deviation from the mean. The variance is the square of the standard deviation.
Population standard deviation:
Sample standard deviation:
Population variance:
Sample variance:
Example: Comparing dispersion between two universities using histograms and standard deviation.


The Empirical Rule and Chebyshev's Inequality
The Empirical Rule
For bell-shaped (normal) distributions:
~68% of data within 1 standard deviation of the mean
~95% within 2 standard deviations
~99.7% within 3 standard deviations
Formula: for k = 1, 2, 3
Chebyshev's Inequality
For any distribution, at least of data lie within k standard deviations of the mean (k > 1).
Measures from Grouped Data
Approximate Mean and Standard Deviation
When only frequency distributions are available, approximate the mean and standard deviation using class midpoints and frequencies.
Approximate mean:
Approximate standard deviation:
Weighted Mean
The weighted mean is calculated by multiplying each value by its weight, summing these products, and dividing by the sum of the weights.
Formula:
Measures of Position and Outliers
Z-Scores
The z-score measures how many standard deviations a value is from the mean.
Population z-score:
Sample z-score:
Percentiles and Quartiles
Percentiles indicate the relative standing of a value in a data set. Quartiles divide data into four equal parts:
Q1: 25th percentile
Q2: 50th percentile (median)
Q3: 75th percentile
Interquartile Range (IQR)
The IQR is the range of the middle 50% of the data:
Checking for Outliers
Outliers are extreme values that may affect analysis. To check for outliers:
Compute Q1 and Q3
Calculate IQR
Lower Fence:
Upper Fence:
Values outside these fences are outliers
The Five-Number Summary and Boxplots
Five-Number Summary
The five-number summary consists of:
Minimum
Q1
Median (Q2)
Q3
Maximum
Boxplots
Boxplots visually display the five-number summary and highlight outliers. The box represents the interquartile range, whiskers extend to the minimum and maximum within the fences, and outliers are marked separately.
Choosing Measures for Reporting
When data are highly skewed or contain extreme values, use the median and interquartile range as resistant measures. For symmetric distributions, the mean and standard deviation are appropriate.
Describing Distributions
To describe a distribution, report its shape (skewed left, right, or symmetric), center (mean or median), and spread (standard deviation or interquartile range).
*Additional info: Academic context and examples were expanded for clarity and completeness. Only directly relevant images were included to reinforce key concepts.*
