 Back
BackPractice Exam Guidance: Sampling Distributions, Confidence Intervals, and Normal Probability
Study Guide - Smart Notes
 Tailored notes based on your materials, expanded with key definitions, examples, and context.
Q1. When is the sampling distribution of all sample means normally distributed?
Background
Topic: Central Limit Theorem & Sampling Distributions
This question tests your understanding of the conditions under which the sampling distribution of sample means is normal. The Central Limit Theorem (CLT) is a key concept here.
Key Terms:
Central Limit Theorem (CLT): States that the sampling distribution of the sample mean approaches a normal distribution as the sample size increases, regardless of the population's distribution, provided certain conditions are met.
Sample Size: The number of observations in a sample.
Population Distribution: The distribution from which the sample is drawn.
Step-by-Step Guidance
Recall the Central Limit Theorem: For large sample sizes (usually ), the sampling distribution of the sample mean is approximately normal, even if the population distribution is not normal.
If the population distribution is already normal, then the sampling distribution of the sample mean is normal for any sample size.
Consider the answer choices: Which options reflect these two conditions?
Try solving on your own before revealing the answer!
Q2. If the sample size is increased, how is margin of error for a confidence interval affected, everything else being equal?
Background
Topic: Margin of Error & Confidence Intervals
This question tests your understanding of how sample size impacts the margin of error in confidence intervals.
Key Terms and Formula:
Margin of Error (): The range within which the true population parameter is expected to lie.
Sample Size (): Number of observations in the sample.
Standard Error ():
Margin of Error Formula:
Step-by-Step Guidance
Recall that the margin of error depends on the standard error, which is inversely related to the square root of the sample size.
As sample size increases, increases, so decreases.
Therefore, the margin of error decreases as sample size increases, all else being equal.
Try solving on your own before revealing the answer!
Q3. The graph of a normal curve is given. If one individual value is selected at random, what is the probability that it is greater than 849?
Background
Topic: Normal Distribution & Probability
This question tests your ability to interpret probabilities from a normal distribution graph. The value 849 is the mean, and the normal curve is symmetric about the mean.
Key Terms:
Normal Distribution: A symmetric, bell-shaped distribution characterized by its mean and standard deviation.
Mean: The center of the distribution (here, 849).
Probability: The area under the curve to the right of 849 represents the probability of selecting a value greater than 849.
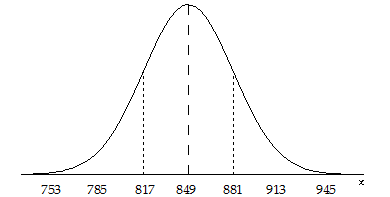
Step-by-Step Guidance
Identify that 849 is the mean of the normal distribution.
Recall that the normal distribution is symmetric about the mean.
The probability of selecting a value greater than the mean is equal to the area under the curve to the right of the mean.
For a normal distribution, this area is exactly half of the total area under the curve.
Try solving on your own before revealing the answer!
Q4. A random sample of 1493 adults was asked “Are you afraid to go out at night within a mile of your home because of crime?” Of that sample, 672 say “Yes.”
Background
Topic: Estimating Proportions & Confidence Intervals
This question tests your ability to estimate population proportions, check normality conditions, and construct confidence intervals.
Key Terms and Formulas:
Point Estimate (): , where is the number of successes and is the sample size.
Sampling Distribution: The distribution of sample proportions.
Normality Condition: and
Confidence Interval for Proportion:
Step-by-Step Guidance
Calculate the point estimate:
Check normality: Compute and to ensure both are at least 5.
Find the critical value for an 86% confidence interval (look up or calculate).
Set up the confidence interval formula:
Interpret the interval: Explain what the confidence interval means in context.
Try solving on your own before revealing the answer!
Q5. A newspaper reported that 21% of all adults in the U.S. are illiterate. Describe the sampling distribution of sample proportions for samples of 125 adults.
Background
Topic: Sampling Distribution of Proportions
This question tests your ability to describe the mean, standard deviation, and shape of the sampling distribution for sample proportions.
Key Terms and Formulas:
Population Proportion (): 0.21
Sample Size (): 125
Mean of Sampling Distribution:
Standard Deviation:
Normality Condition: and
Step-by-Step Guidance
Calculate the mean:
Calculate the standard deviation:
Check normality: and should both be at least 5.
Describe the shape: If normality conditions are met, the distribution is approximately normal.
Try solving on your own before revealing the answer!
