 Back
BackProbability and Hypothesis Testing: Foundations and Applications in Statistics
Study Guide - Smart Notes
 Tailored notes based on your materials, expanded with key definitions, examples, and context.
Probability and Hypothesis Testing
Introduction to Probability
Probability is a foundational concept in statistics, essential for understanding hypothesis testing and inferential statistics. It quantifies the likelihood of events occurring and is used to make predictions based on data.
Probability is expressed on a scale from 0 (impossible event) to 1 (certain event).
Two main approaches: classical (games of chance) and empirical (based on past experience).
Key Terms in Probability
Event (E): The outcome or set of outcomes we are interested in.
Sample Point (S): Any possible outcome of an experiment.
Sample Space (N(S)): The set of all possible outcomes.
Basic Probability Rules
For any event, .
If two events A and B are mutually exclusive: .
If two events A and B are independent: .
Sample Space and Counting Techniques
Determining the sample space is crucial for calculating probabilities. Methods include listing outcomes, tree diagrams, and using the multiplication rule.
For n independent trials with S possible outcomes each: .
Example: Flipping a coin 3 times: possible outcomes.
Probability with Replacement and Without Replacement
Probability calculations differ depending on whether items are replaced after each draw.
With replacement: The sample space remains the same for each draw.
Without replacement: The sample space decreases after each draw.
Example: Drawing colored gumballs from a jar.

Conditional Probability
Conditional probability is the probability of an event given that another event has occurred. It is denoted as .
Formula:
Example: Probability of dying from COVID given age group or infection status.
Discrete Probability Distributions
Binomial Probability Distribution
The binomial distribution models the probability of obtaining a fixed number of successes in a fixed number of independent trials, each with the same probability of success.
Conditions:
n trials, each with two possible outcomes (success/failure)
Probability of success (p) is constant
Trials are independent
Probability of r successes in n trials:
, where and
Example: Flipping a coin 8 times and finding the probability of 7 or 8 heads.
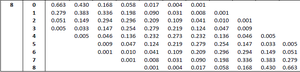
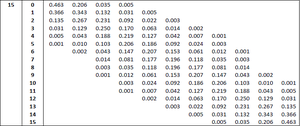
Using Binomial Probability Tables
Tables provide probabilities for various combinations of n, p, and r. They are useful for quickly finding probabilities without manual calculation.
Geometric Distribution
The geometric distribution models the probability that the first success occurs on the x-th trial.
Formula: , where p is the probability of success and q is the probability of failure.
Example: Probability that a certain response is first observed on the fourth interview.
Poisson Distribution
The Poisson distribution estimates the probability of a given number of events occurring in a fixed interval of time or space, assuming events occur at a constant rate.
Formula: , where is the average rate.
Example: Probability of observing a certain number of alarms in a night.
Normal Probability Distributions
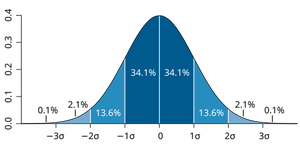
The Normal Distribution
The normal distribution is a continuous probability distribution that is symmetric about the mean, with most values clustering around the center.
Characterized by mean () and standard deviation ().
Standard normal distribution has and .
Z-Scores
A z-score indicates how many standard deviations a value is from the mean. It allows comparison across different normal distributions.
Population formula:
Sample formula:
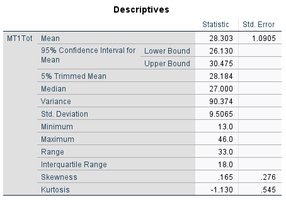
Descriptive Statistics Example
Descriptive statistics summarize data using measures such as mean, median, standard deviation, and range.
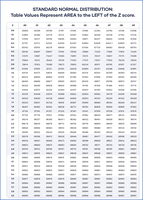
Standard Normal Table (Z-Table)
The z-table provides the area (probability) to the left of a given z-score in the standard normal distribution. It is used to find percentiles and probabilities for normally distributed data.
Combinatorics in Probability
Combinations
Combinatorics is used to count the number of ways events can occur. The number of combinations of n items taken r at a time is:
Factorial notation:
Used in binomial probability calculations.
Summary Table: Probability Distributions
Distribution | Key Features | Formula | Example Application |
|---|---|---|---|
Binomial | Fixed n, two outcomes, constant p, independent trials | Coin flips, survey responses | |
Geometric | First success on x-th trial | First occurrence of an event | |
Poisson | Events in interval, constant rate | Number of arrivals, rare events | |
Normal | Continuous, symmetric, bell-shaped | Test scores, heights |
Additional info: These notes provide foundational concepts for probability and hypothesis testing, including practical examples, formulas, and the use of statistical tables. Understanding these principles is essential for further study in inferential statistics and data analysis.
