 Back
Probability and Normal Distribution: Study Notes for Introductory Statistics
Study Guide - Smart Notes
 Tailored notes based on your materials, expanded with key definitions, examples, and context.
Probability Concepts
Random Processes and the Law of Large Numbers
Probability theory studies random processes, where outcomes are uncertain but can be described mathematically. The Law of Large Numbers states that as the number of trials increases, the experimental probability approaches the theoretical probability.
Random Process: An experiment or situation with uncertain outcomes.
Law of Large Numbers: Over many repetitions, the average result converges to the expected value.
Example: Flipping a fair coin many times; the proportion of heads approaches 0.5.
Probability Vocabulary
Experimental Probability: Probability based on observed outcomes.
Theoretical Probability: Probability calculated using mathematical principles.
Sample Space: The set of all possible outcomes.
Probability: A measure of how likely an event is, ranging from 0 (impossible) to 1 (certain).
Complement: The probability that an event does not occur.
Probability Rules and Models
Probabilities must satisfy certain rules:
Range:
Sum of all outcomes:
Probability models organize possible outcomes and their probabilities.
Example Probability Model Table
X | P(x) |
|---|---|
0 | 0.2 |
1 | 0.15 |
2 | ? |
3 | 0.25 |
Additional info: The missing probability can be found by ensuring the sum is 1.
Sample Space and Calculating Probabilities
For experiments like rolling dice, the sample space lists all possible outcomes. Probabilities are calculated by counting favorable outcomes and dividing by the total number of outcomes.
Example: Rolling two dice, the probability of a sum of 7 is .
Probability Model Verification
To verify a probability model, check that all probabilities are between 0 and 1 and their sum is 1.
Color | P(c) |
|---|---|
R | 0.3 |
G | 0.15 |
BL | 0 |
BR | 0.15 |
Y | 0.2 |
O | 0.2 |
Addition and Complement Rules
Addition Rule
The addition rule calculates the probability of either event A or B occurring:
Formula:
Mutually Exclusive: If A and B cannot occur together, .
Complement Rule
The complement rule finds the probability that an event does not occur:
Formula:
Multiplication Rule and Independence
Independent and Dependent Events
Events are independent if the occurrence of one does not affect the other. Otherwise, they are dependent.
Conditional Probability: is the probability of B given A.
Multiplication Rule
Formula:
For independent events:
Discrete Probability Distributions
Discrete Probability and Expected Value
A discrete probability distribution assigns probabilities to each possible value of a random variable.
Expected Value (Mean):
Standard Deviation:
Example: Calculating the expected payout in a game show.
Binomial Distribution
The binomial distribution models the number of successes in a fixed number of independent trials, each with the same probability of success.
Binomial Probability Formula:
Mean:
Standard Deviation:
The Normal Distribution
Introduction to the Normal Curve and Empirical Rule
The normal distribution is a continuous probability distribution characterized by its bell-shaped curve. It is symmetric about the mean and follows the Empirical Rule.
Area under the curve: 1
Center: Mean ()
Empirical Rule: 68% of data within 1 standard deviation, 95% within 2, 99.7% within 3.
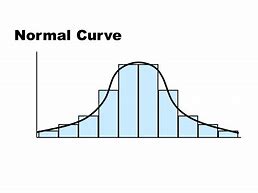
Standard Normal Curve
The standard normal distribution has mean 0 and standard deviation 1. Z-scores measure how many standard deviations a value is from the mean.
Z-score formula:
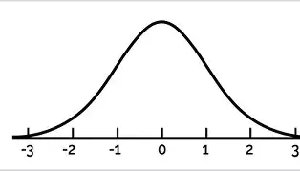
Applications of the Normal Distribution
Normal distributions are used to estimate probabilities and percentiles for real-world data, such as heights, weights, and test scores.
Example: Calculating the probability that a randomly selected value falls within a certain range.
Percentiles: Finding the value corresponding to a given percentile using the inverse normal function.
Empirical Rule Table
Interval | Approximate Probability |
|---|---|
Within 1 st. dev. | 68% |
Within 2 st. dev. | 95% |
Within 3 st. dev. | 99.7% |
Summary
This guide covers foundational probability concepts, rules, discrete and binomial distributions, and the normal distribution, including calculation methods and real-world applications. Mastery of these topics is essential for understanding statistical inference and data analysis.
