 Back
BackProbability and Probability Distributions: Core Concepts and Applications
Study Guide - Smart Notes
 Tailored notes based on your materials, expanded with key definitions, examples, and context.
Probability: Basic Concepts
Definitions and Interpretation
Probability is a measure of how likely an event is to occur, expressed as a number between 0 and 1. The closer the probability is to 1, the more certain the event is to happen; a probability of 0 means the event is impossible.
Event: Any collection of outcomes from a probability experiment.
Simple Event: An outcome that cannot be broken down into simpler components.
Sample Space: The set of all possible outcomes of a procedure.
P(A): Denotes the probability of event A occurring.
Probabilities are always expressed as fractions or decimals between 0 and 1.
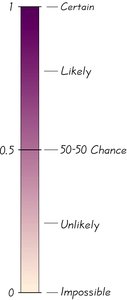
Impossible Event: Probability = 0
Certain Event: Probability = 1
Unlikely Event: Probability close to 0
Likely Event: Probability close to 1
Example: Rolling a die: Sample space = {1, 2, 3, 4, 5, 6}. Event A: "Getting an even number" = {2, 4, 6}.
Rules for Computing Probabilities
Relative Frequency Approximation:
Classical (Theoretical) Probability: , where s = number of ways A can occur, n = total equally likely outcomes.
Subjective Probability: Estimated using knowledge of relevant circumstances.
Law of Large Numbers: As an experiment is repeated, the relative frequency probability approaches the actual probability.
Rules of Probability
Addition Rule
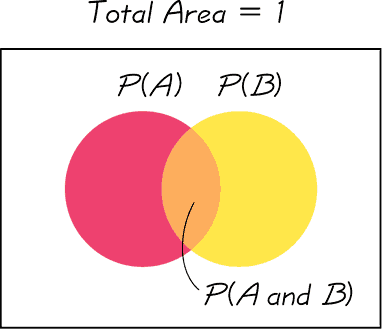
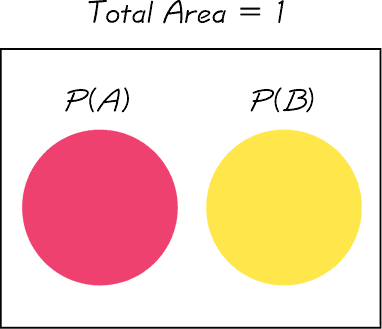
The addition rule is used to find the probability that event A or event B (or both) occur in a single trial.
Formal Addition Rule:
Disjoint (Mutually Exclusive) Events: Events that cannot occur at the same time. For disjoint events, .
Example: If selecting a student, the probability that the student is wearing glasses or contacts is found using the addition rule.
Complementary Events
The complement of event A (denoted as \( \overline{A} \)) consists of all outcomes in which A does not occur.
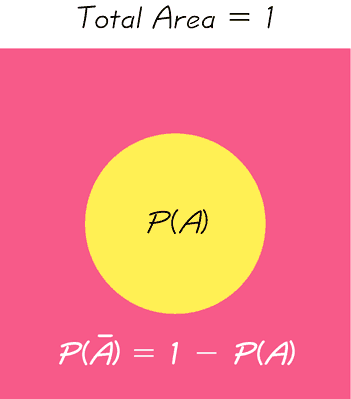
Example: If 19.8% of college students take at least one class online, the probability that a student does not take any online class is .
Multiplication Rule and Conditional Probability
Multiplication Rule
The multiplication rule is used to find the probability that event A occurs in the first trial and event B occurs in the second trial.
Formal Multiplication Rule:
Independent Events: If A and B are independent, , so
Dependent Events: The probability of B is affected by the occurrence of A.
Conditional Probability
Conditional probability is the probability of event B occurring given that event A has already occurred.
Example: If 44 out of 1000 subjects use drugs and have a positive test, and 59 have a positive test, then .
Counting Principles in Probability
Fundamental Counting Rule
If one event can occur in m ways and a second event in n ways, the events together can occur in ways.
Factorial Rule
The number of ways to arrange n different items is (n factorial).
(by definition)
Permutations and Combinations
Permutations: Order matters. Number of ways to arrange r items from n:
Combinations: Order does not matter. Number of ways to choose r items from n:
Example: Number of ways to choose 3 people from 7:
Probability Distributions
Random Variables and Probability Distributions
A probability distribution lists each possible value of a random variable together with its probability.
Random Variable: A variable whose value is determined by chance.
Discrete Random Variable: Takes countable values.
Continuous Random Variable: Takes infinitely many values, associated with measurements.
Requirements for a probability distribution:
Each probability is between 0 and 1 inclusive.
The sum of all probabilities is 1.
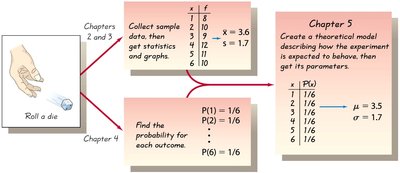
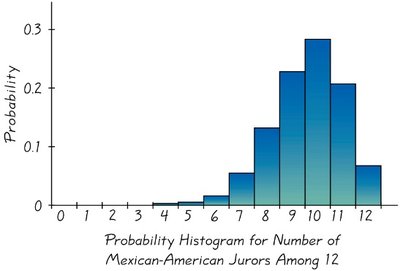
Probability Distribution Histogram
A probability histogram visually represents the probability distribution of a discrete random variable.
Mean, Variance, and Standard Deviation of a Probability Distribution
Mean (Expected Value):
Variance:
Standard Deviation:
Expected Value (E): The mean value of the outcomes, representing the long-term average if the experiment is repeated many times.
Binomial Probability Distributions
Definition and Properties
A binomial probability distribution arises from a procedure that meets these criteria:
Fixed number of trials (n)
Each trial is independent
Each trial has two possible outcomes (success or failure)
The probability of success (p) is the same for each trial
Notation:
n = number of trials
p = probability of success
q = probability of failure = 1 - p
x = number of successes in n trials
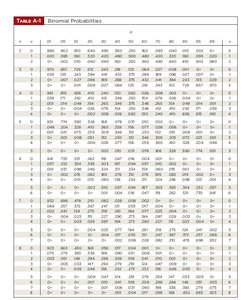
Binomial Probability Formula
The probability of getting exactly x successes in n trials is:
where
Parameters for Binomial Distributions
Mean:
Variance:
Standard Deviation:
Range Rule of Thumb: Values are unusual if they lie outside .
Applications and Examples
Finding the probability of a certain number of successes in repeated independent trials (e.g., number of students who donated blood, number of correct answers on a test by guessing).
Using the binomial probability table for quick lookup of probabilities.
Additional info: The notes above include expanded definitions, formulas, and examples to ensure completeness and clarity for exam preparation. All images included directly reinforce the adjacent explanations.
