 Back
BackProbability Distribution, Mean, and Standard Deviation for a Discrete Random Variable
Study Guide - Smart Notes
 Tailored notes based on your materials, expanded with key definitions, examples, and context.
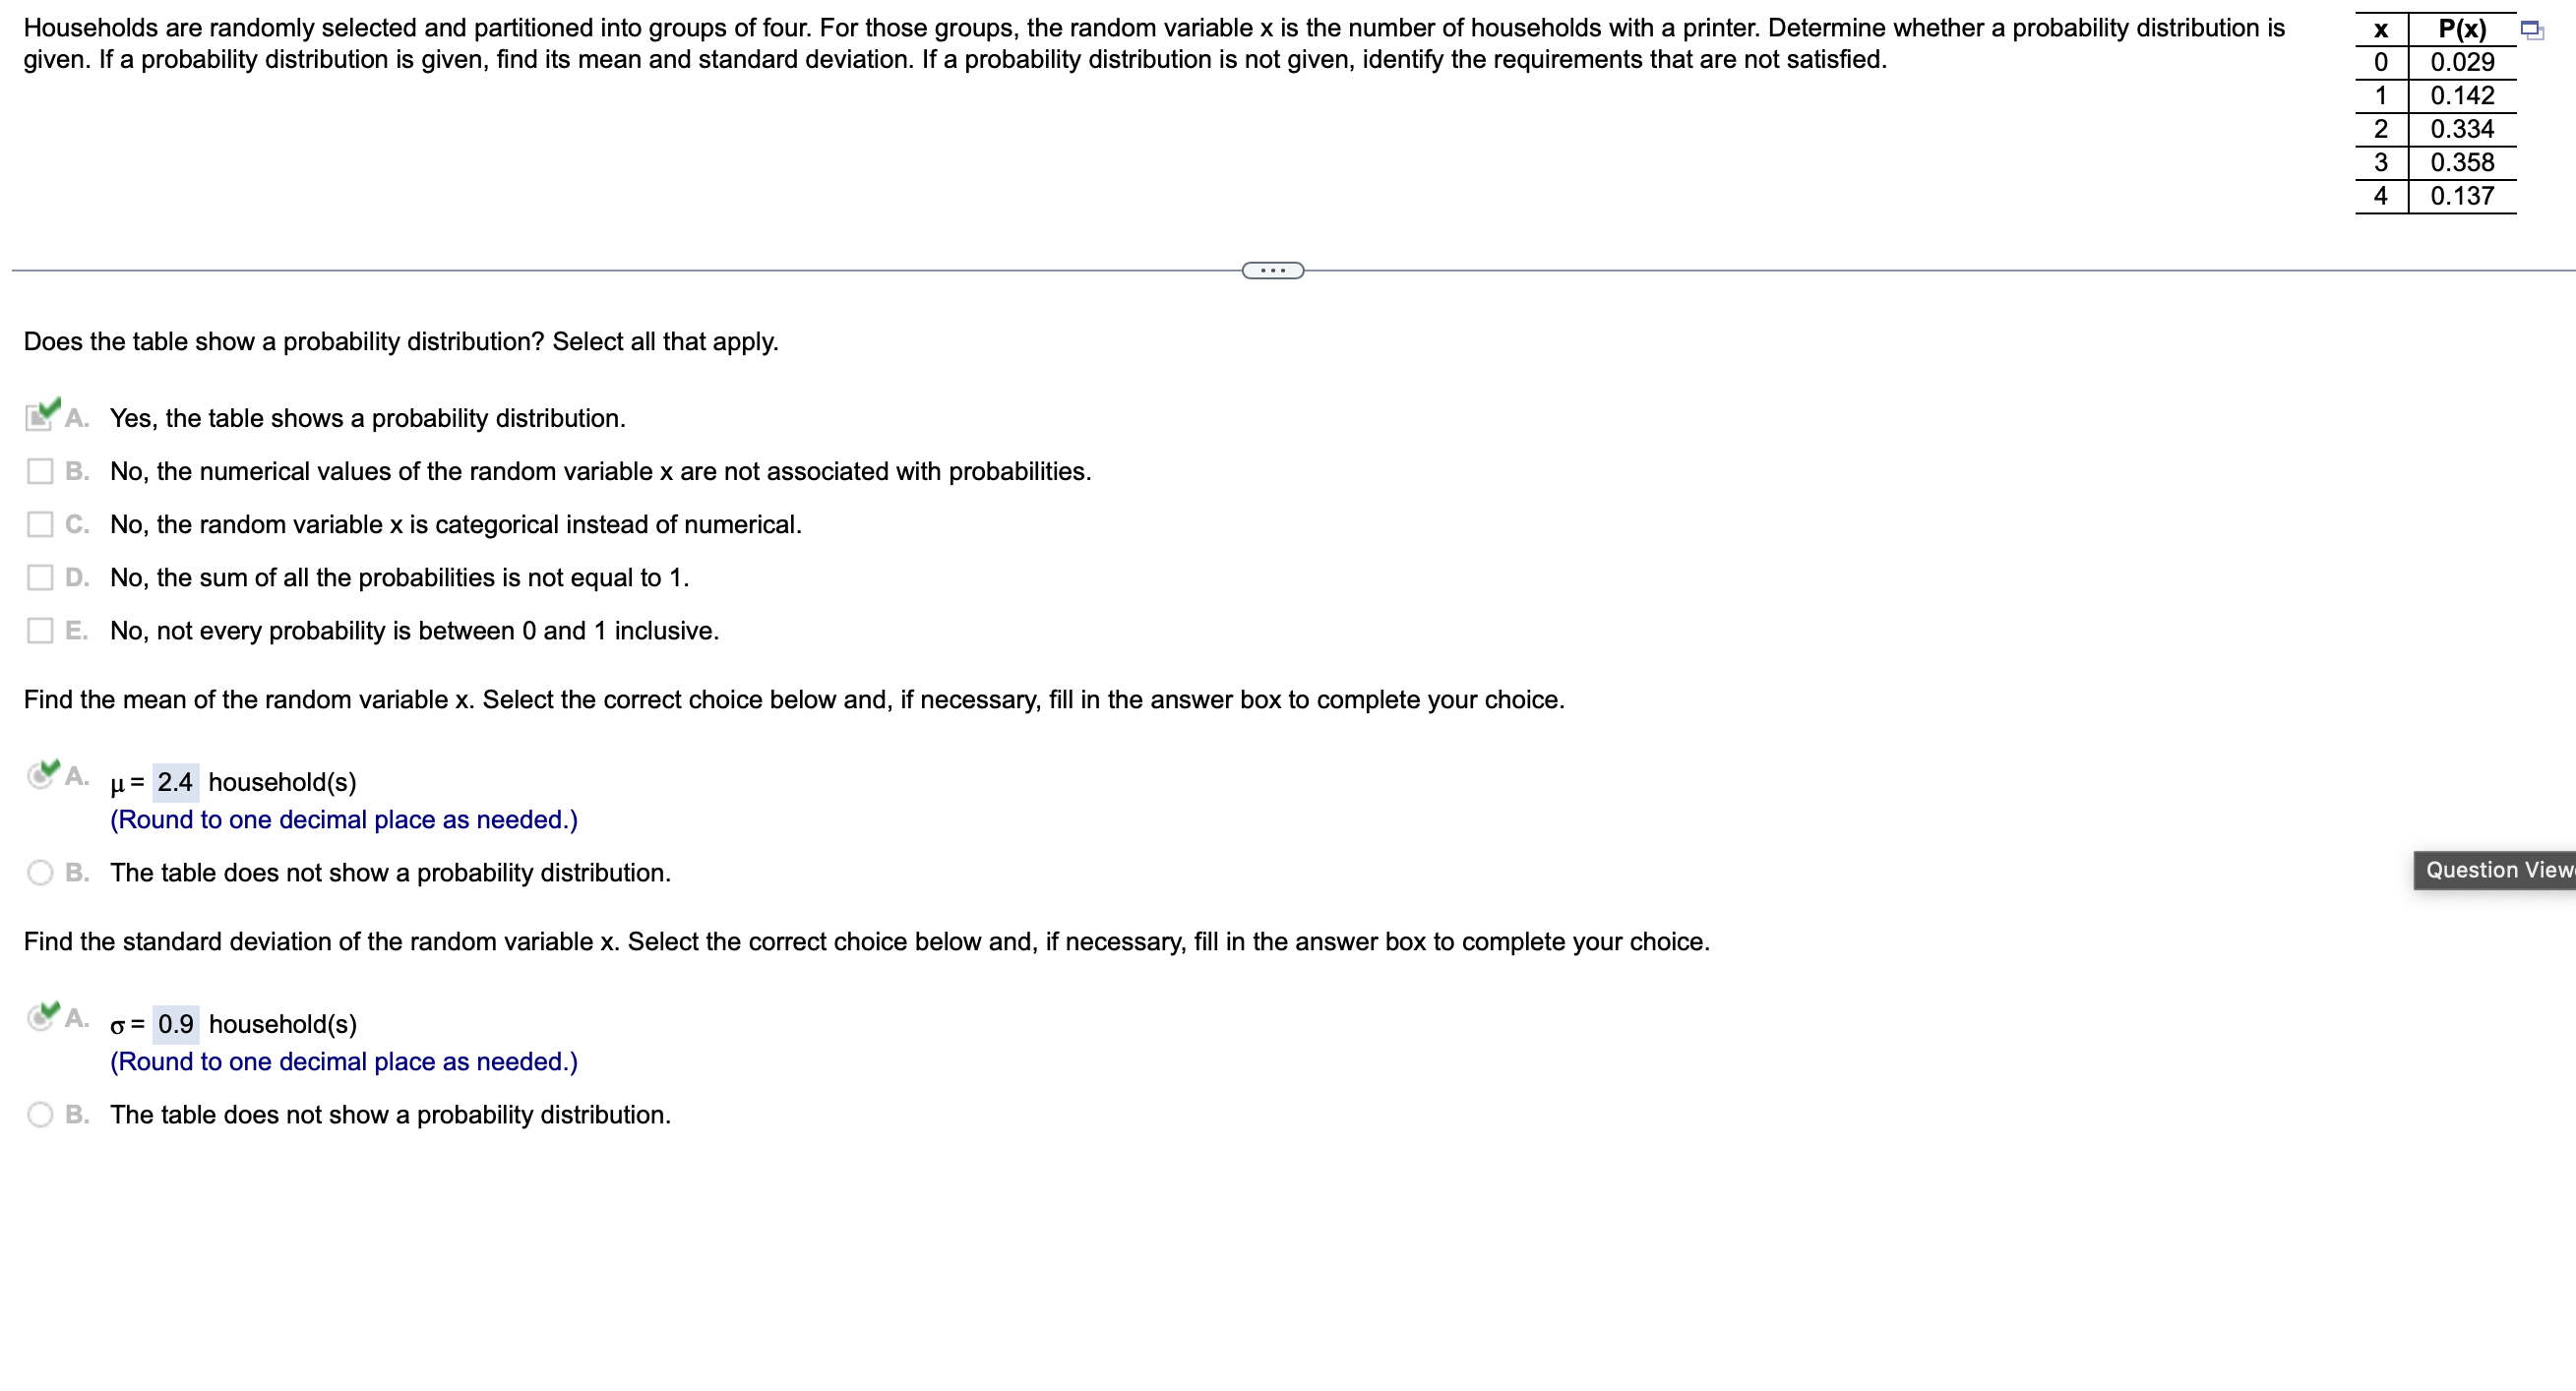
Q1. Does the table show a probability distribution?
Background
Topic: Probability Distributions
This question tests your understanding of the requirements for a probability distribution for a discrete random variable. You need to check if the values of are associated with valid probabilities and if those probabilities meet certain criteria.
Key Terms:
Discrete random variable: A variable that can take on a countable number of values.
Probability distribution: A table or function that gives the probabilities of each possible value of a random variable.
Requirements for a Probability Distribution:
Each probability must be between 0 and 1 inclusive.
The sum of all probabilities must equal 1: .
The random variable must be numerical.
Step-by-Step Guidance
Check that all values are between 0 and 1. Look at the table and verify each probability.
Sum all the probabilities: . Is the total equal to 1?
Confirm that is a numerical random variable (number of households with a printer).
Try solving on your own before revealing the answer!
Q2. Find the mean of the random variable .
Background
Topic: Expected Value (Mean) of a Discrete Probability Distribution
This question is testing your ability to calculate the mean (expected value) of a discrete random variable using its probability distribution.
Key Formula:
Where:
= mean (expected value)
= value of the random variable
= probability of
Step-by-Step Guidance
Multiply each value of by its corresponding probability : for each row.
Add up all these products to get the mean: .
Try solving on your own before revealing the answer!
Q3. Find the standard deviation of the random variable .
Background
Topic: Standard Deviation of a Discrete Probability Distribution
This question is testing your ability to calculate the standard deviation, which measures the spread of the random variable values around the mean.
Key Formula:
Where:
= standard deviation
= value of the random variable
= mean (expected value)
= probability of
Step-by-Step Guidance
For each value of , subtract the mean and square the result: .
Multiply each squared difference by its probability: .
Add up all these products.
Take the square root of the sum to get the standard deviation: .
Try solving on your own before revealing the answer!
Final Answers:
Q1: Yes, the table shows a probability distribution. All probabilities are between 0 and 1, the sum is 1, and is numerical.
Q2: household(s). This is the expected number of households with a printer in a group of four.
Q3: household(s). This measures the variability in the number of households with a printer.
